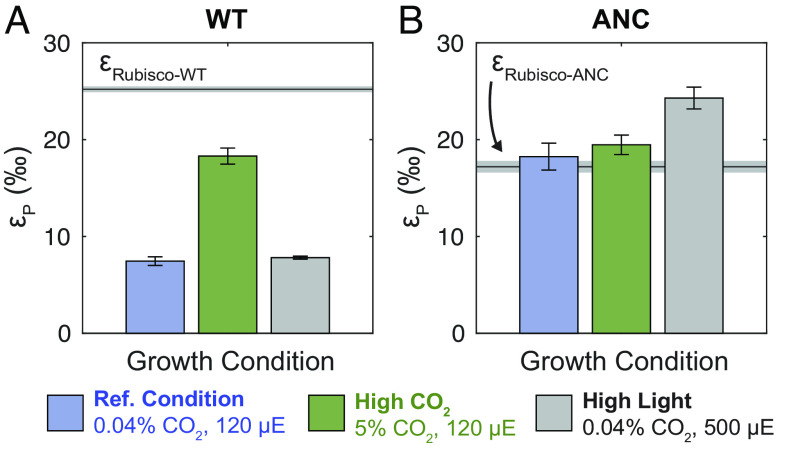
Fig. 4.
Whole-cell carbon isotope fractionation by WT and ANC strains. εp (‰) values (avg. ± SE) for (A) WT and (B) ANC strains across growth conditions. For each strain, the maximum εp possible based on the traditional model (εp = εRubisco) is shown as a gray line (avg. ± SE). Most measured ANC εP values exceed the theoretical limit (εp > εRubisco-ANC + SE), while WT εp values do not (εp < εRubisco-WT + SE). WT εp values increase in response to elevated CO2 concentrations, while ANC εp values increase in response to elevated light flux. See SI Appendix, Table S3 for full results.

