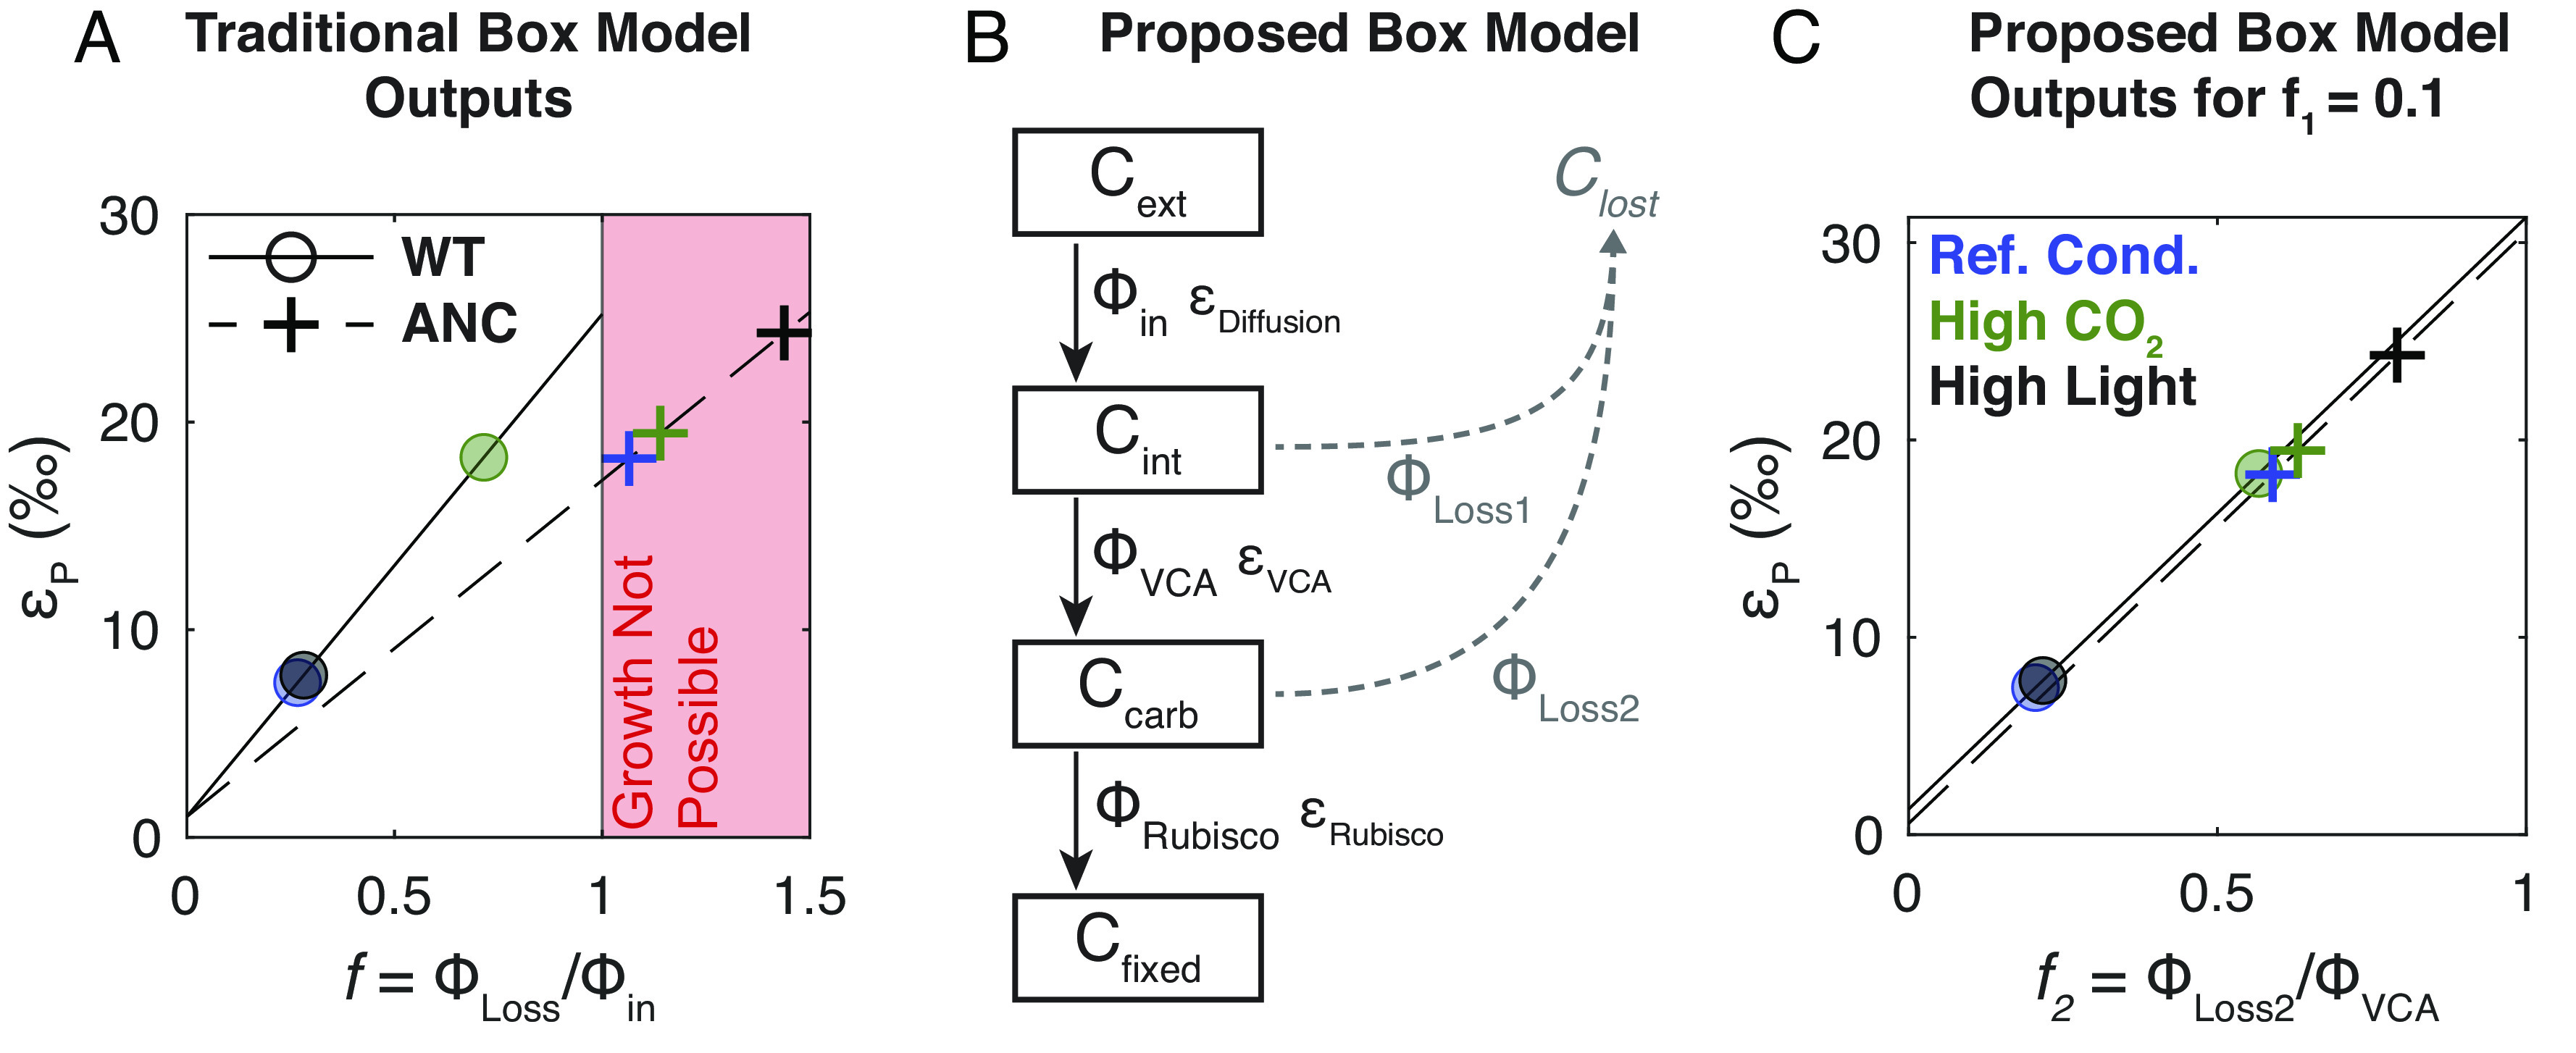
Fig. 5.

Proposed box model based on experimental results. (A) Experimental results (circles and crosses) plotted onto traditional box model outputs (solid and dashed lines) for WT and ANC, respectively, if Ci uptake is all CO2. See SI Appendix, Table S11 for quantification of uncertainty. Colors indicate growth conditions as in Fig. 2. The red shaded region demarcates the physiologically infeasible region where f > 1. (B) Our proposed box model architecture. Subscripts indicate external (ext), internal (int), carboxysome (carb), and fixed (fixed) carbon pools. Fluxes are denoted by Φ where subscripts indicate fluxes into the cell (in), out of the cell (Loss1, Loss2), into the carboxysome (VCA for Vectoral Carbonic Anhydrase), and into fixed biomass (Rubisco), each with a corresponding isotopic fractionation denoted with ε. Loss fluxes were assumed to have no isotopic fractionation. In this model, f1 is defined as ΦLoss1/Φin, and f2 is defined as ΦLoss2/ΦVCA. (C) Experimental results plotted onto proposed box model outputs for f1 = 0.1; colors and symbols are the same as Panel A; see SI Appendix, Table S11 for quantification of uncertainty. εp is defined as the difference in δ13C between Cext and Cfixed. Here only results for f1 = 0.1 are shown; see SI Appendix, Supplementary Text for full description of model assumptions and results.
