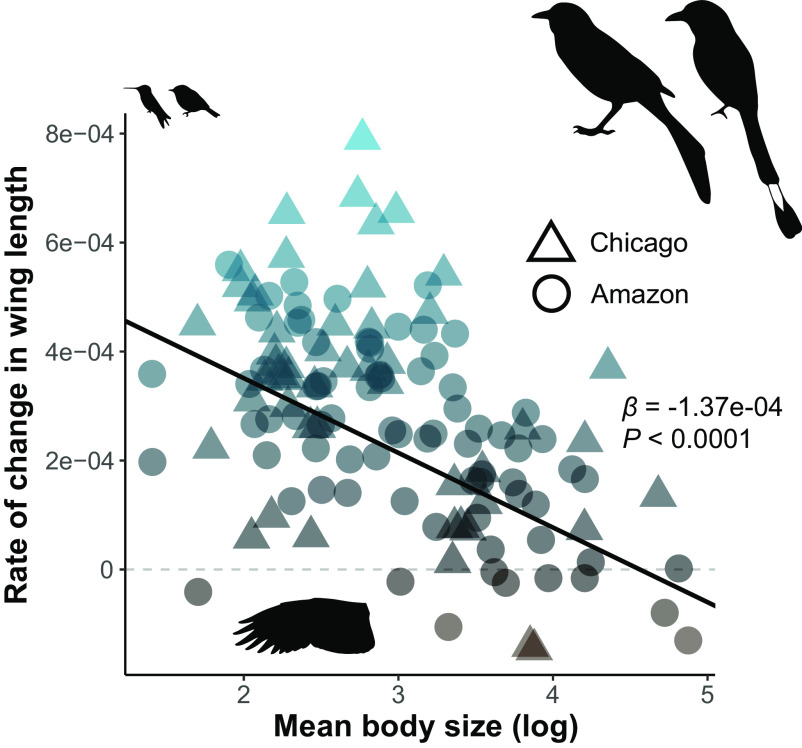
Fig. 3.
Rates of wing length change in the Chicago and Amazonian species were similar and were significantly associated with species’ mean body size. Points show the rates of change in wing length for each of the 52 Chicago and 77 Amazonian species derived from our mixed-effects models. The black line shows the partial model coefficient where body size predicted rate of change (i.e., P ≤ 0.05) with the slope estimate and p-value derived from our PGLS analysis given on the right. Bird silhouettes depict the species at the extremes of body mass for Amazonian (Thalurania furcata, Momotus momota) and Chicago (Regulus satrapa, Quiscalus quiscula) datasets.

