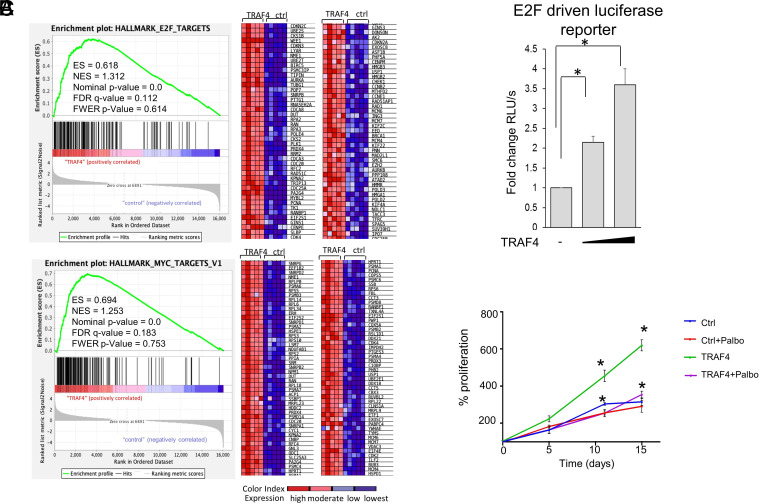
Fig. 2.
TRAF4 overexpression drives E2F pathway activation to promote CRPC. (A) Gene set enrichment analysis (GSEA) of the genes associated with TRAF4 overexpression in LNCaP cells under androgen-deprived culture condition. Genes enriched in E2F, and MYC pathways with the normalized enrichment scores (NES), nominal P-value and false discovery rate (FDR) q-value are shown. The green line plots show the enrichment of genes associated with TRAF4 overexpression (Left). The normalized enrichment score indicates the ranking list of gene expression differences of TRAF4 overexpression from control cells. The genes associated with the leading edge of the enrichment score are shown in the heat map (Right). The color gradient matches the expression status of individual genes, as shown in the color index. (B) TRAF4 increases E2F transcriptional activity. Shown is an E2F-driven luciferase reporter assay in LNCaP cells transiently transfected with the luciferase reporter and a TRAF4-expressing plasmid. (C) Inhibition of E2F activation abolishes TRAF4-promoted androgen-independent growth. Control or TRAF4-overexpressing LNCaP cells were grown in an androgen-deprived culture medium treated with the CDK4/6 inhibitor Palbociclib (1 µM) or vehicle. The cell growth was monitored through the MTS assay. * represents P < 0.05.

