Fig. 1.
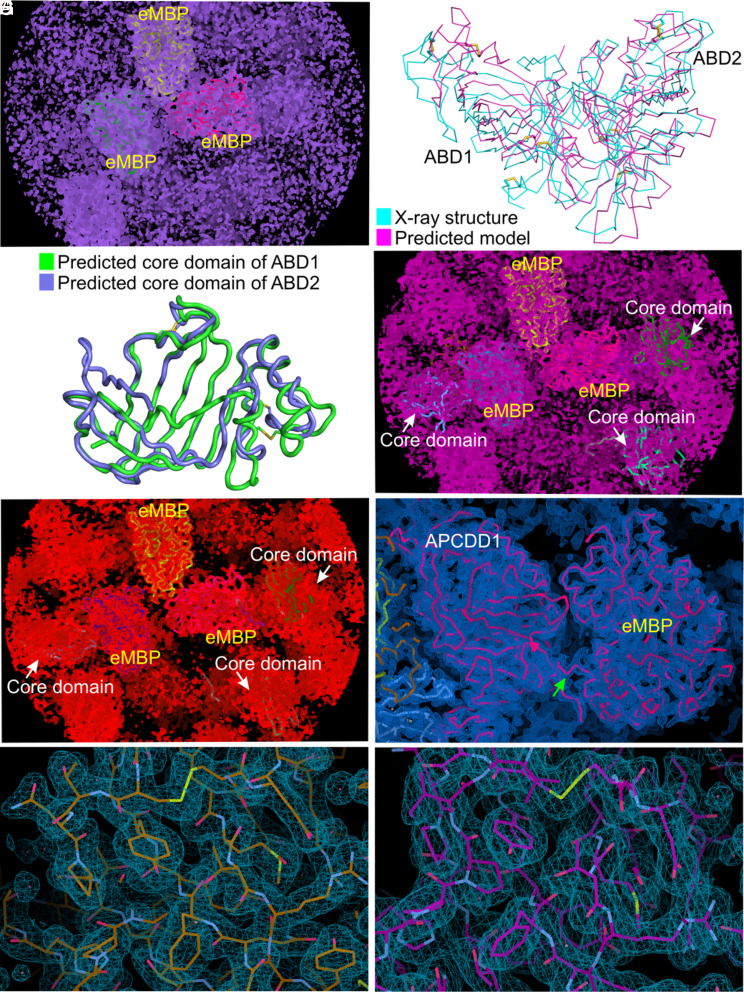
Electron density map and chain tracing of eMBP-APCDD1. (A) The initial electron density map (purple meshes) of eMBP-APCDD1 contoured at the 1.8 σ level after molecular replacement in PHASER using eMBP structures as the search model. Three eMBP copies (yellow, green, and magenta) fit into the electron density, whereas the electron density for APCDD1 is not interpretable. (B) Superposition of predicted APCDD1 model which was generated using RoseTTAFold and X-ray structure of APCDD1 (with rmsd of 3.79 Å over 358 Cα atoms) revealed high structural difference. (C) Superposition of predicted models of the β-barrel regions of ABD1 and ABD2, generated using RoseTTAFold, referred to as the core domain for molecular replacement. (D) The electron density (pink meshes) contoured at the 1.8 σ level after molecular replacement in PHASER with three eMBP copies fixed and using predicted models of core domains as search models. (E) The electron density modified map (red meshes) from PARROT contoured at the 1.8 σ level. (F) The sigmaA-weighted 2|FO|-|FC| electron density (blue meshes) after refinement in PHENIX contoured at the 1.3 σ level. The structure of the eMBP-APCDD1 fusion protein is shown as a ribbon representation (magenta). The linker between eMBP and APCDD1 is indicated by a green arrow. (G) The sigmaA-weighted 2|FO|-|FC| electron density (blue meshes) contoured at the 1.0 σ level. A close-up view of APCDD1 structure (chain A of crystal-form I) is shown as sticks. (H) The sigmaA-weighted 2|FO|-|FC| electron density (blue meshes) contoured at the 1.0 σ level. A close-up view of the APCDD1 structure (chain A of crystal-form II) is shown as sticks.

