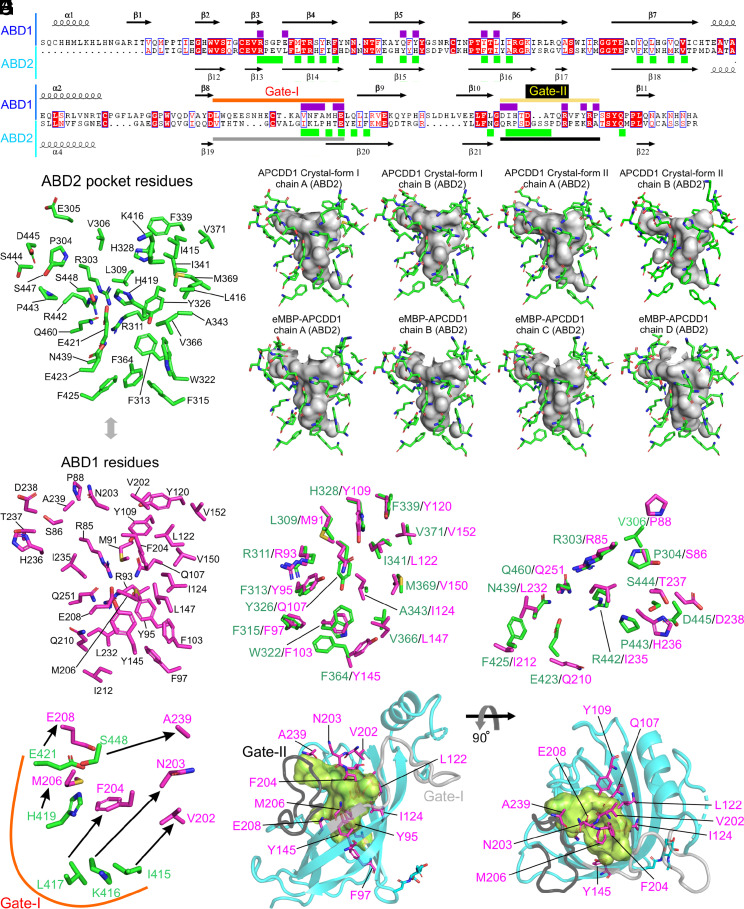
Fig. 5.
Structural analysis and comparison of hydrophobic pockets of ABD1 and ABD2. (A) Structure-based sequence alignment of ABD1 with ABD2. Secondary structure elements are represented. Purple and green rectangles highlight residues lining the hydrophobic pockets of ABD1 and ABD2, respectively. The regions of Gate-I and Gate-II are marked with horizontal colored lines. (B) Residues lining the hydrophobic pocket of ABD2 are shown as sticks and labeled. (C) The interior volume of the ABD2 pocket (gray), rendered with CASTp ((29)) together with residues that line it, are shown as green sticks, for the eight APCDD1 structures determined in this study. (D) Stick representation of ABD1 residues corresponding to the residues that line the ABD2 hydrophobic pocket. (E–G) ABD1 and ABD2 were superimposed (Fig. 3A and B) and subsets of the corresponding pairs of ABD1 and ABD2 residues were visualized as sticks (magenta for ABD1 and green for ABD2): (E) pairs with high spatial similarity; (F) pairs with moderate spatial similarity; (G) pairs with low spatial similarity (connected by arrows). (H) ABD2 ribbon diagram (cyan; with Gate-I and Gate-II colored light and dark gray, respectively) and the hydrophobic pocket rendered as a green interior volume. Select ABD1 residues that occupy or partially occupy the ABD2 hydrophobic pocket are visualized as magenta sticks with their positions and orientations determined by the superposition of ABD1 and ABD2.

