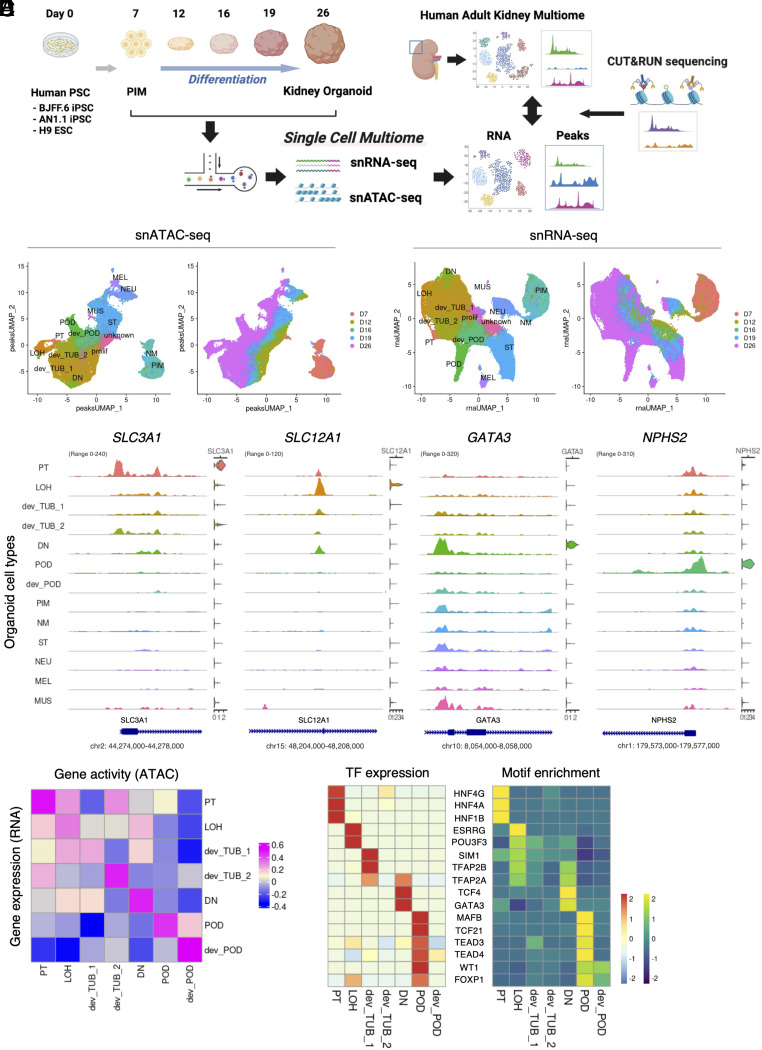
Fig. 1.
Characterization of gene expression and open chromatin accessibility of human kidney organoid differentiation. (A) Schematic of this study. Samples were collected at multiple time points from day 7 to day 26 during organoid differentiation. The collected samples were dissociated into single cells and nuclei were extracted. snRNA-seq and snATAC-seq libraries were generated from the extracted nuclei using the 10X Genomics single-cell ATAC and gene expression kit. After sequencing, each organoid multiome dataset was merged and processed for analysis. Human adult kidney multiome dataset [Muto et al. (10)] was used to relatively evaluate day 26 kidney organoids. CUT&RUN sequencing was employed to evaluate chemical annotation of ATAC peaks. (B) UMAP plots of chromatin accessible peaks of the merged kidney organoid differentiation multiome dataset. Left plot shows each organoid cell type cluster. Right plot shows origin of time points during differentiation. PT, proximal tubule; LOH, Loop of Henle; dev_TUB, developing tubule; DN, distal nephron; POD, podocyte; dev_POD, developing podocyte; PIM, posterior intermediate mesoderm; NM, nascent mesoderm; ST, stromal cell; NEU, neural cell; MEL, melanocyte; MUS, muscle cell; prolif, proliferating cell; unknown, undefined type of cell. (C) UMAP plots of gene expression of the merged kidney organoid differentiation multiome dataset. Left plot shows each organoid cell type cluster. Right plot shows origin of time point during differentiation. (D) Coverage plots showing ATAC peaks around transcription start site and gene expression levels of SLC3A1 (PT), SLC12A1 (LOH), GATA3 (DN), and NPHS2 (POD) genes in each cluster of the merged kidney organoid differentiation multiome dataset. (E) Heatmap showing Pearson’s correlation coefficient between gene expression and gene activity of each cluster in nephron-lineage cells of the merged kidney organoid differentiation multiome dataset. (F) Heatmap showing gene expression levels (Left) and motif enrichment in ATAC peaks (Right) of top-listed transcription factors in nephron-lineage cells of the merged kidney organoid differentiation multiome dataset.

