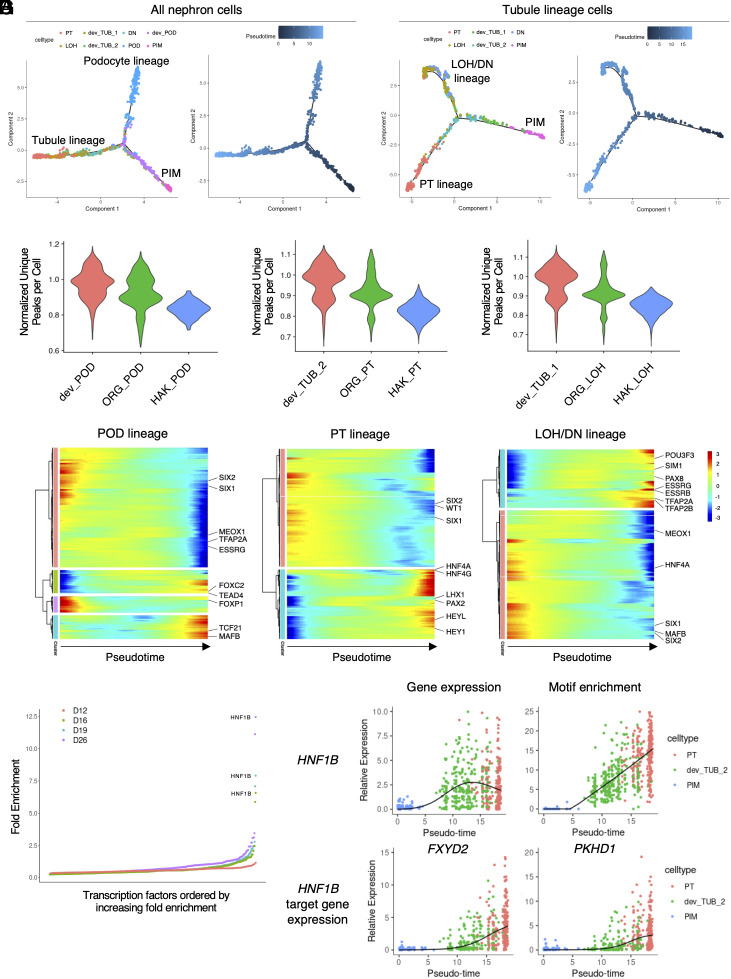
Fig. 3.
Gene regulatory dynamics during kidney organoid differentiation. (A) Pseudotime ordering plots of nephron-lineage cells using snRNA-seq modality showing podocyte and tubule-lineage branches. Colors are based on cell type (Left) and pseudotime (Right). (B) Subordering plots of tubule-lineage cells along pseudotime showing PT and LOH/DN lineage branches. Colors are based on cell type (Left) and pseudotime (Right). (C) Violin plots of number of unique peaks per cell, normalized for read depth, in differentiating (red) and differentiated (green) podocytes (POD, Left), proximal tubules (PT, Middle), and loop of Henle (LOH, Right) of day 26 kidney organoids and those of human adult kidneys (blue). (D) Heatmaps showing motif enrichment changes along pseudotime of podocyte (POD, Left), proximal tubule (PT, Middle), and loop of Henle and distal nephron (LOH/DN, Right) lineages. (E) Transcription factor enrichment in the PT lineage cells at each time point. (F and G) Dynamics of gene expression (F, Left) and motif enrichment (F, Right) of the HNF1B gene and their target gene expression changes (G) along pseudotime.

