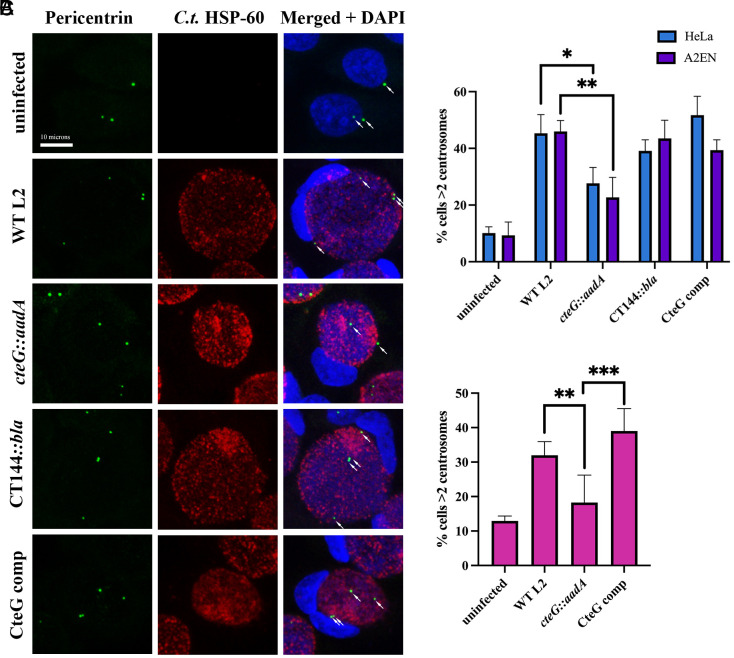
Fig. 3.
Centrosomes are amplified in a CteG-dependent manner during chlamydial infection. (A) Representative images of centrosomes in A2EN cells 36 h postinfection with WT L2, cteG::aadA, CT144::bla, or CteG comp. Cells were stained with C.t. HSP-60 (red), pericentrin (green), and DAPI (blue). White arrows indicate centrosomes (Scale bar, 10 microns). (B) Quantification of cells with supernumerary centrosomes (>2) at 36 h postinfection in A2EN (purple) and HeLa (blue) cells. (C) Quantification of cells with supernumerary centrosomes (>2) at 36 h postinfection in primary cervical cells. (B and C) Error bars are SD, *P < 0.05, **P < 0.01, ***P < 0.001. Significance was determined using one-way ANOVA followed by Tukey’s multiple comparisons test. Data are representative of two to three replicates.

