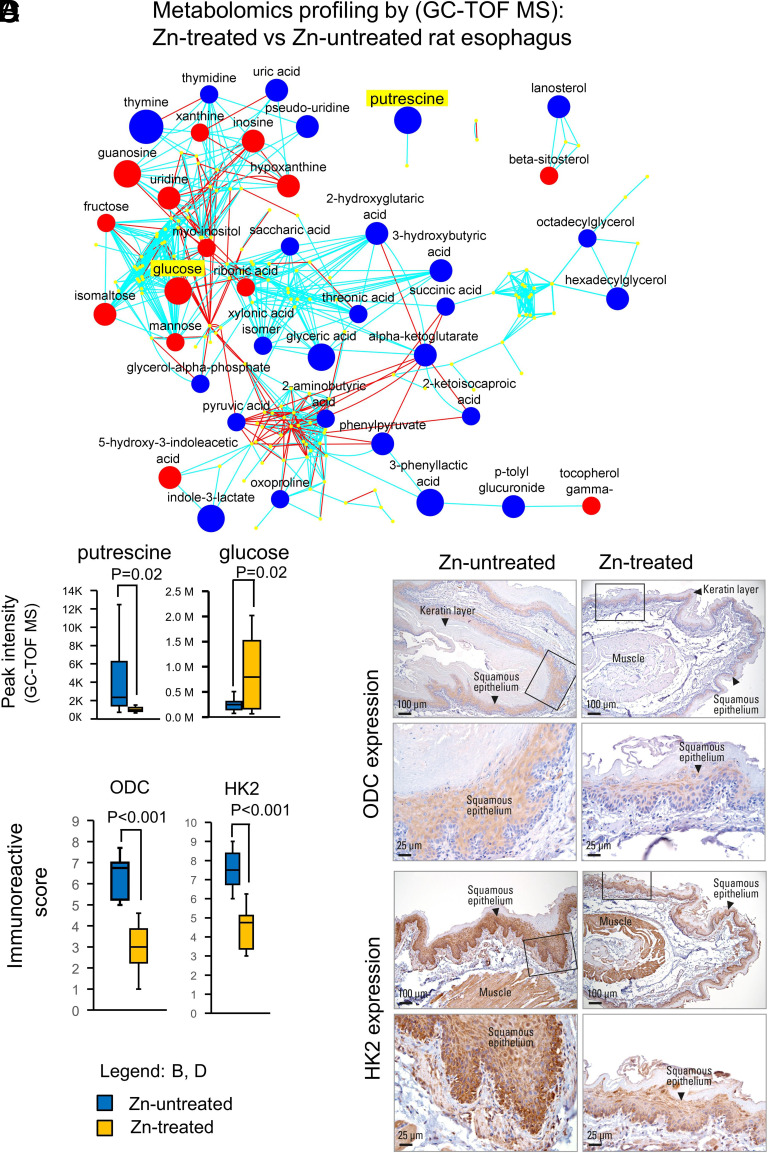
Fig. 4.
Zn treatment reverses ESCC metabolic phenotype in ZD rats. (A) Metabolomic profiling by GC-TOF MS on Zn-treated vs. Zn-untreated rat esophagus. A metabolomic network among the structurally identified metabolites was constructed (using the KEGG databases and PubChem compound identification [CID]) showing 14 up- and 24 downregulated metabolites. Each labeled node represents an identified and significantly altered metabolite (P < 0.05, t test; n = 10 rats per group). Blue and red nodes are significantly decreased and increased metabolites. The size of the nodes represents the size of the fold-change (Zn-treated vs. untreated). Blue lines are edges connected due to Tanimoto similarity; red lines are edges connected through KEGG reaction pairs. (B) Box and whisker plot (with median denoted by the line through the box and whiskers representing values within 1.5 IQR of the first and third quartile) showing distribution of putrescine and glucose metabolic activities and significantly reduced putrescine (P = 0.02) and increased glucose levels (P = 0.02) in Zn-treated vs. Zn-untreated esophagus. (C) IHC analysis of metabolite enzymes ODC (rate-limiting enzyme that converts ornithine to putrescine) expression and HK2 (rate-limiting enzyme and first obligatory step of glucose metabolism) expression in Zn-treated vs. Zn-untreated rat esophagus Representative esophageal photo showing moderate to strong immunostaining for ODC and HK2 in Zn-untreated esophagus as compared to weak and diffuse staining for the same protein in Zn-treated esophagus. HK2 and ODC expression (brown, 3,3′-diaminobenzidine tetrahydrochloride, DAB, counterstain, Harris modified hematoxylin). (D) Box and whisker plot showing distribution of ODC and HK2 immunoreactive score and significantly reduced ODC and reduced HK2 protein expression (P < 0.001) in Zn-treated vs. Zn-untreated esophagus.

