
Fig. 4.
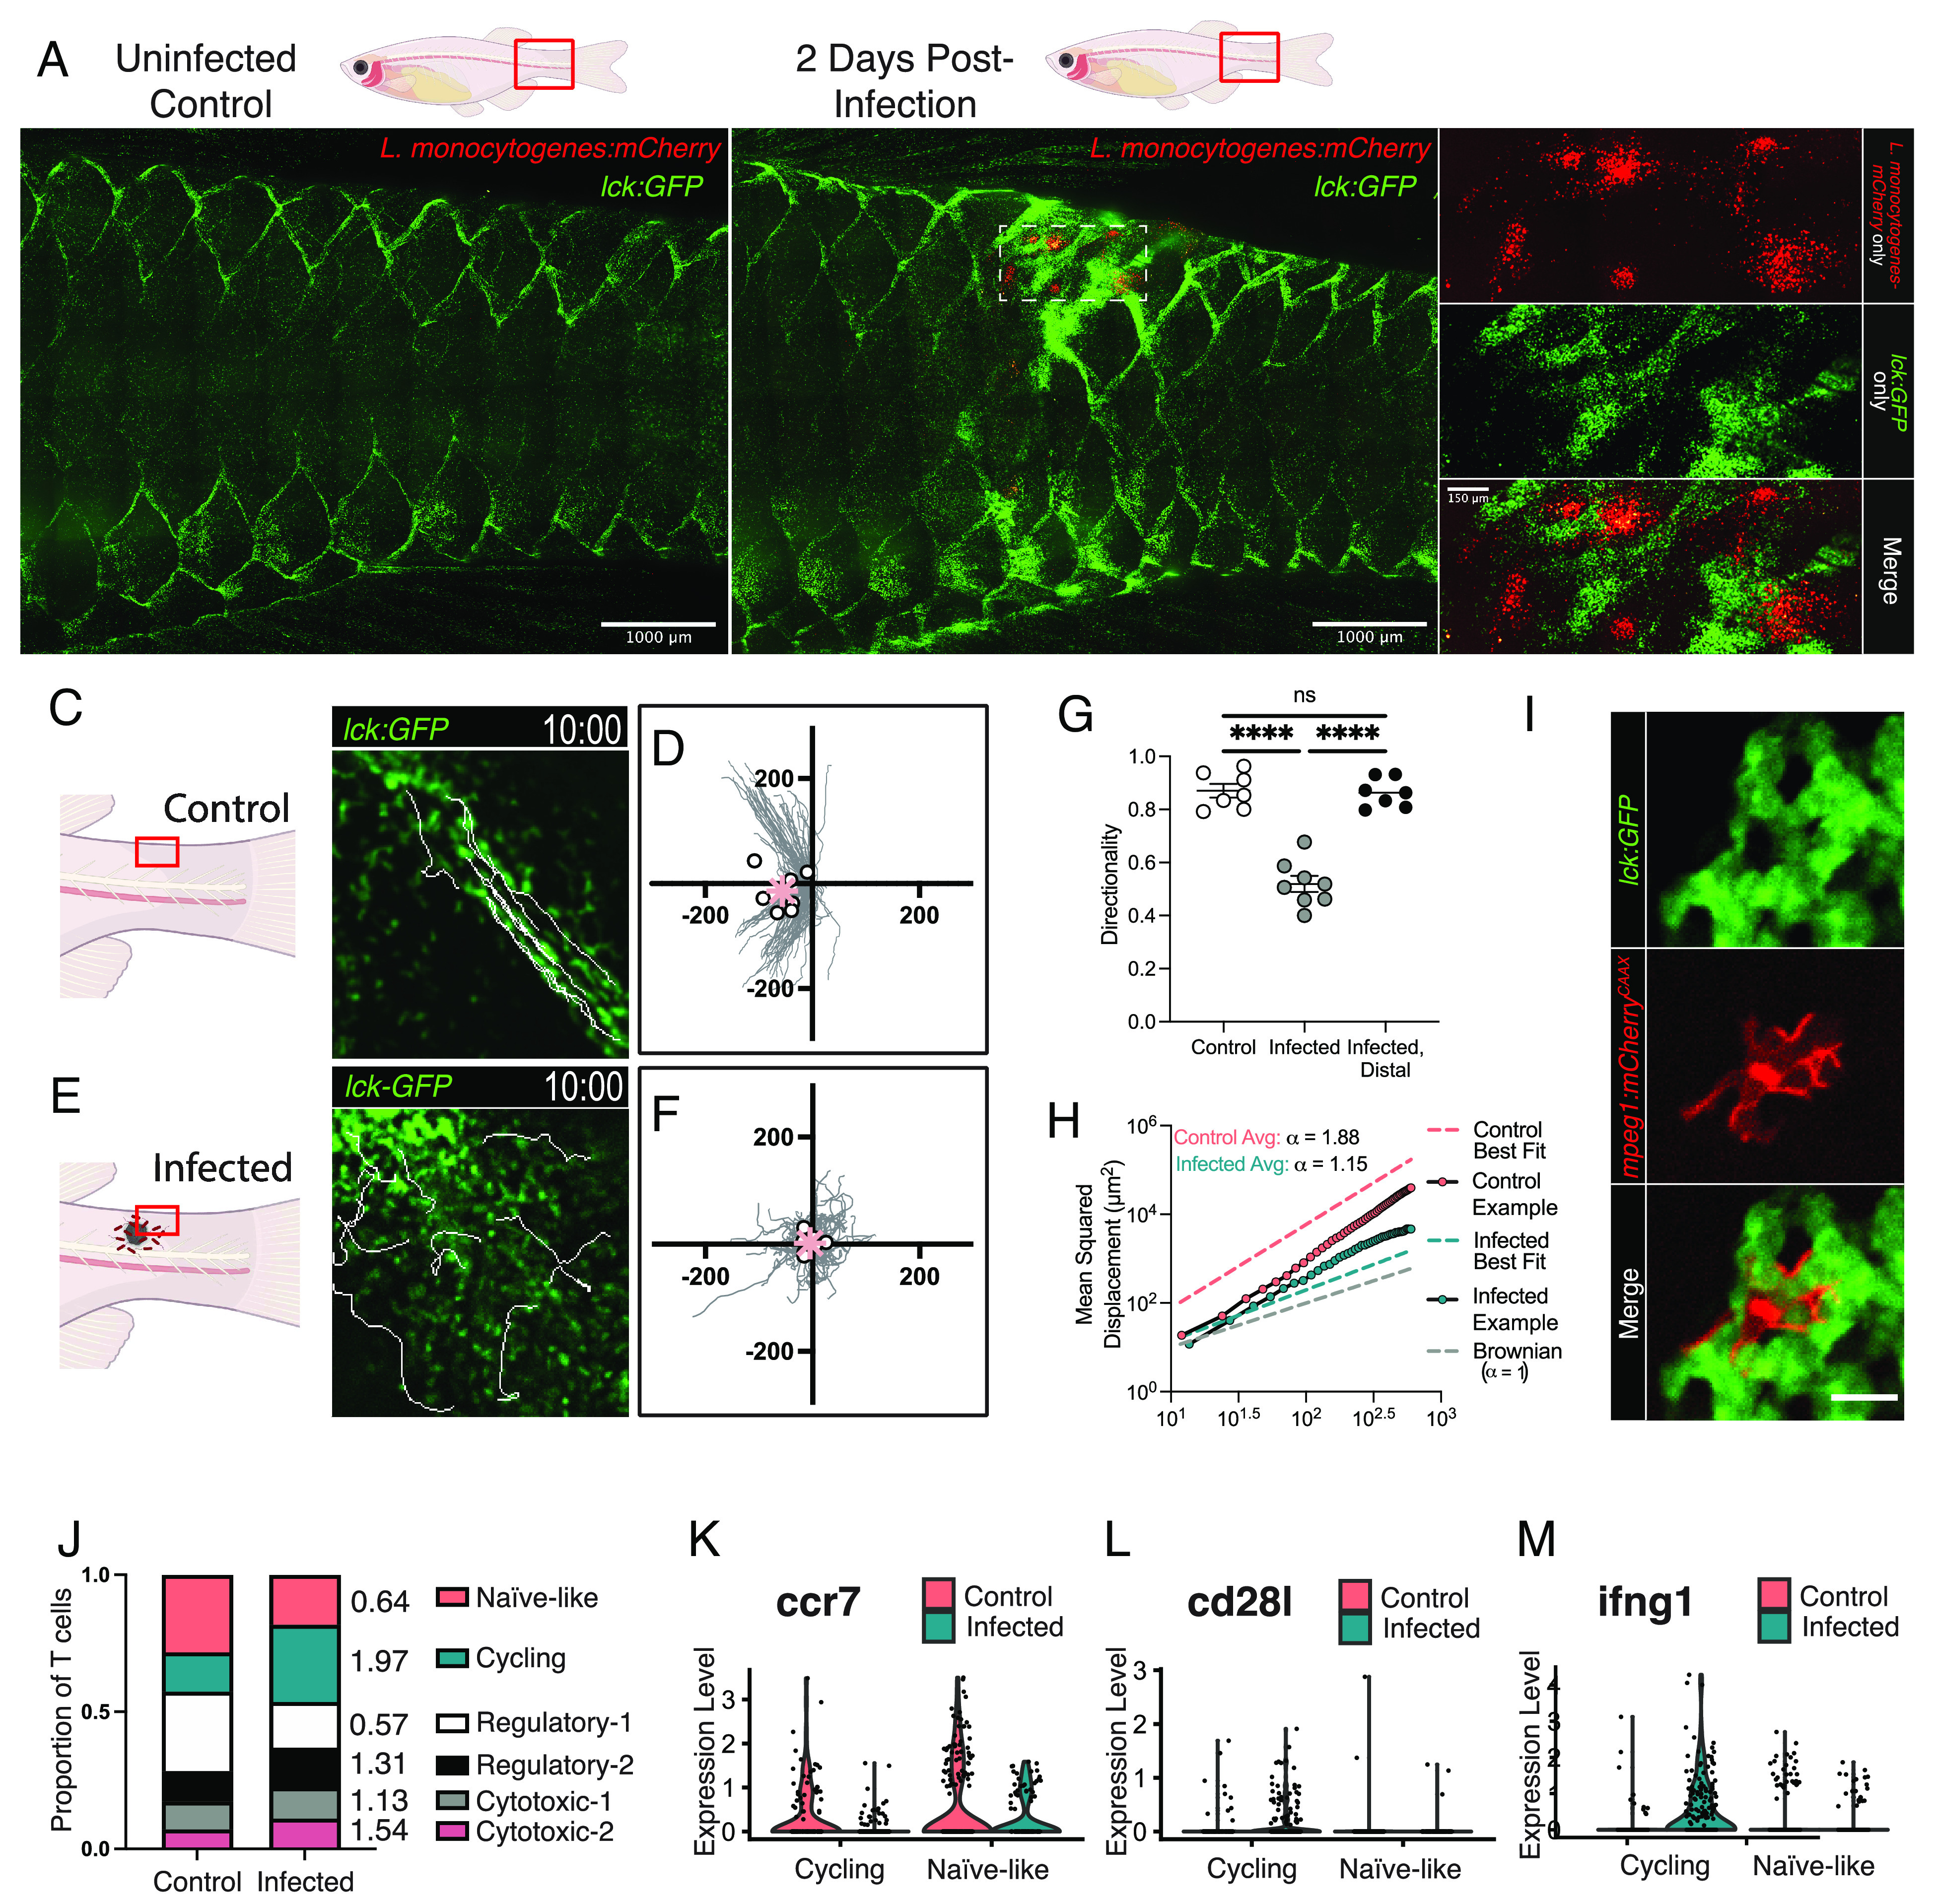
TLN T cells transition to a random walk during infection to scan APCs. (A and B) T cells accumulate around infections in tg(lck:GFP) zebrafish at 2 dpi with mCherry-expressing L. monocytogenes. (C and E) Altered T cell motility at 2 dpi (E) compared to control (C), with 10 overlaid cell tracks. (D and F) Ten-minute cell tracks from 7 to 8 uninfected (d) or 2 dpi (f) tg(lck:GFP;cd4-1:mCherry) fish pooled from three independent experiments. Dots = average movement per fish, asterisk = average total movement. The scale is in microns. (G) Infected-proximal but not infected-distal T cells exhibit reduced directionality, with each dot corresponding to the average of an individual fish pooled from three independent experiments. Means compared with an ordinary one-way ANOVA. (H) Representative plots of MSD versus time indicate departure from the superdiffusive motion characteristic of noninfected fish toward more Brownian-like diffusion in proximal T cells of infected fish at 2 dpi. Values of α were determined as an average of five fish for each condition (control vs. infection); however, plots only depict representative examples from a single control and single infected fish. Model-fitting statistics for all fish is in SI Appendix, Fig. S4E. (I) T cells associate with infection-proximal macrophages in tg(lck:GFP;mpeg1-mcherryCAAX) fish. (Scale bar = 10 microns (J) Proportions of T cell subtypes in control and infected conditions with fold-change noted. (K–M) Violin plots show the expression levels of ccr7 (K), cd28l (L), and ifng1 (M), in cycling and naïve-like T cells harvested by descaling control or infected fish.