Fig. 3.

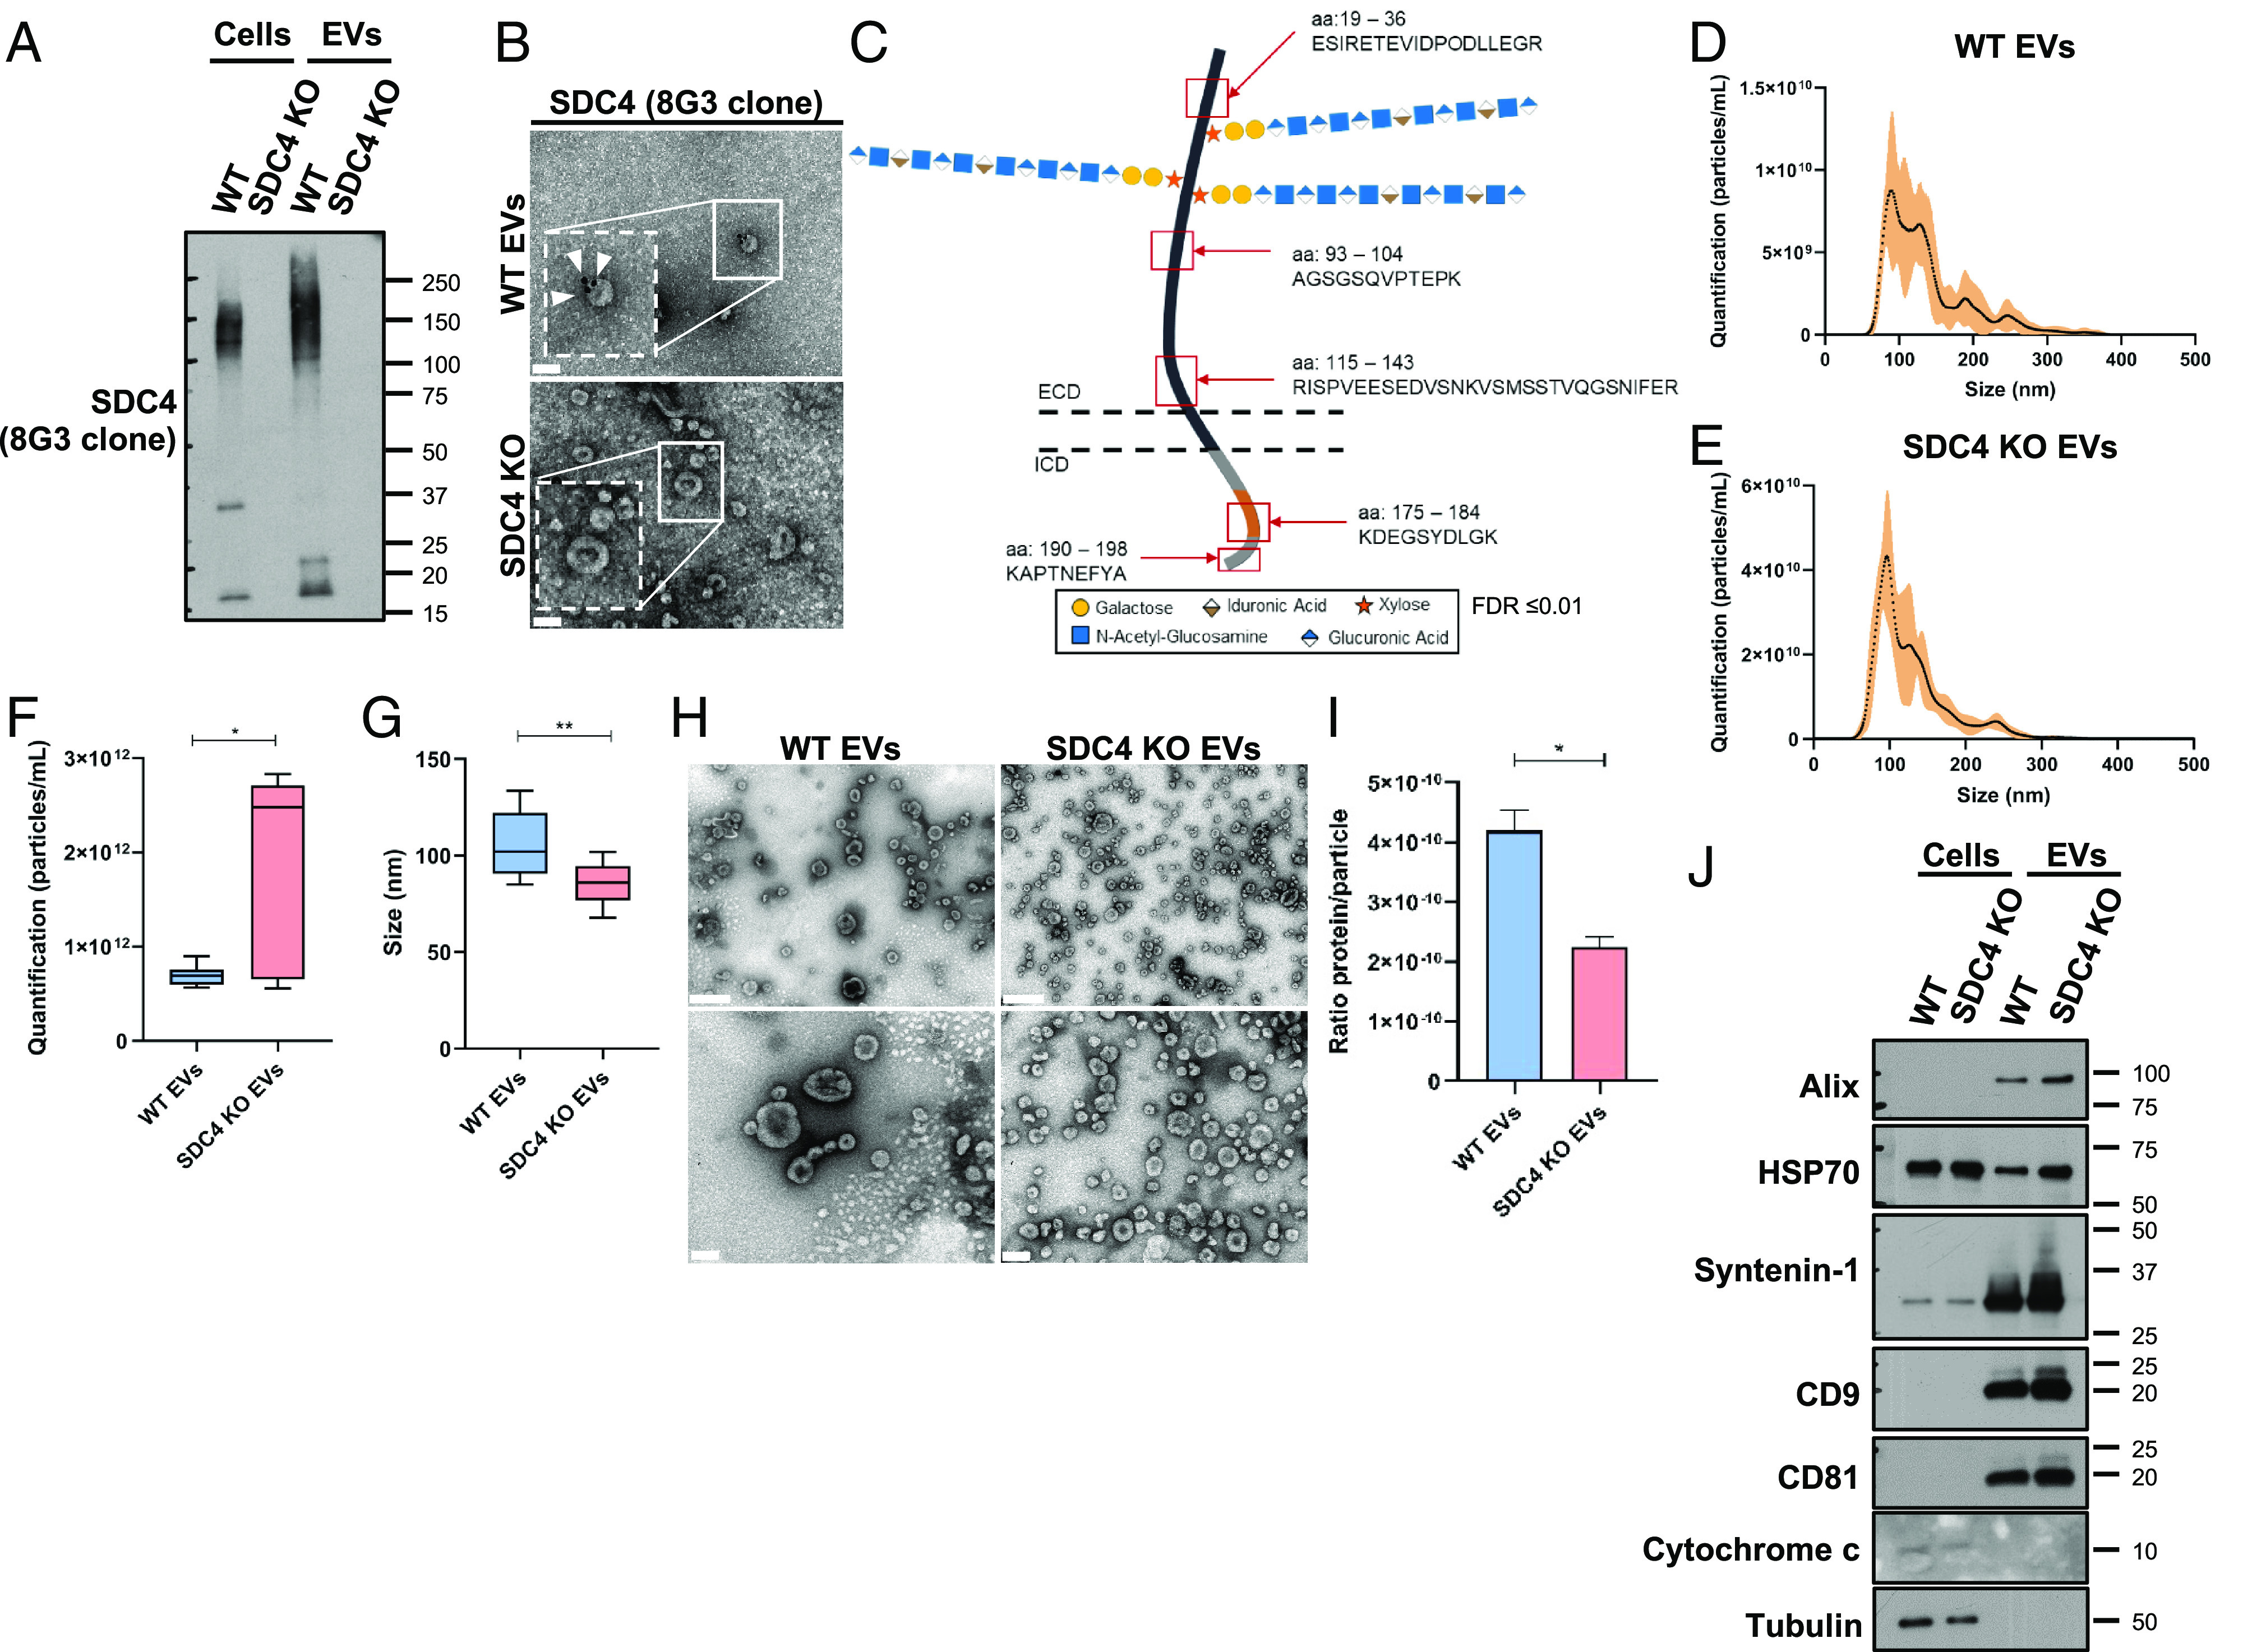
SDC4 is carried by gastric cancer cell EVs and affects EV secretion and size. (A) WB of SDC4 (8G3) in WT and KO cells and EVs. (B) Gold-immunolabeling of SDC4 (8G3) in EVs isolated from WT and KO cells. Scale bar corresponds to 100 nm and white arrowheads point the labeling. (C) Schematic representation of SDC4 showing the sequenced peptides (red squares) in ECD and ICD (variable region in orange and conserved region in grey) by mass spectrometry (MS) analysis. (D and E) Concentration and size distribution analysis using NTA of EVs isolated from (D) WT and (E) KO cells. (F and G) Quantification of the (F) concentration and (G) size of the WT and KO EVs. Bar graphs show the median of the concentration and the median of the size of EVs ± SD. Data from two independent biological replicates. (H) Representative images of negative staining in TEM of the WT and KO EVs. On the Top panel, the scale bar corresponds to 200 nm and below to 100 nm. (I) Bar graphs show the average of the ratio protein per particle ± SD. Data from two independent biological replicates. (J) WB analysis of EV-markers [Programmed cell death 6-interacting protein (Alix), Heat shock 70 (HSP70), syntenin-1, CD9 antigen (CD9), CD81 antigen (CD81)] using WT and KO, cells and EVs. Cytochrome c was used as control for EV fraction isolation and α-tubulin as loading control. Statistical significance was assessed using Student’s t test with Welch’s correction. *P ≤ 0.05, **P < 0.01.
