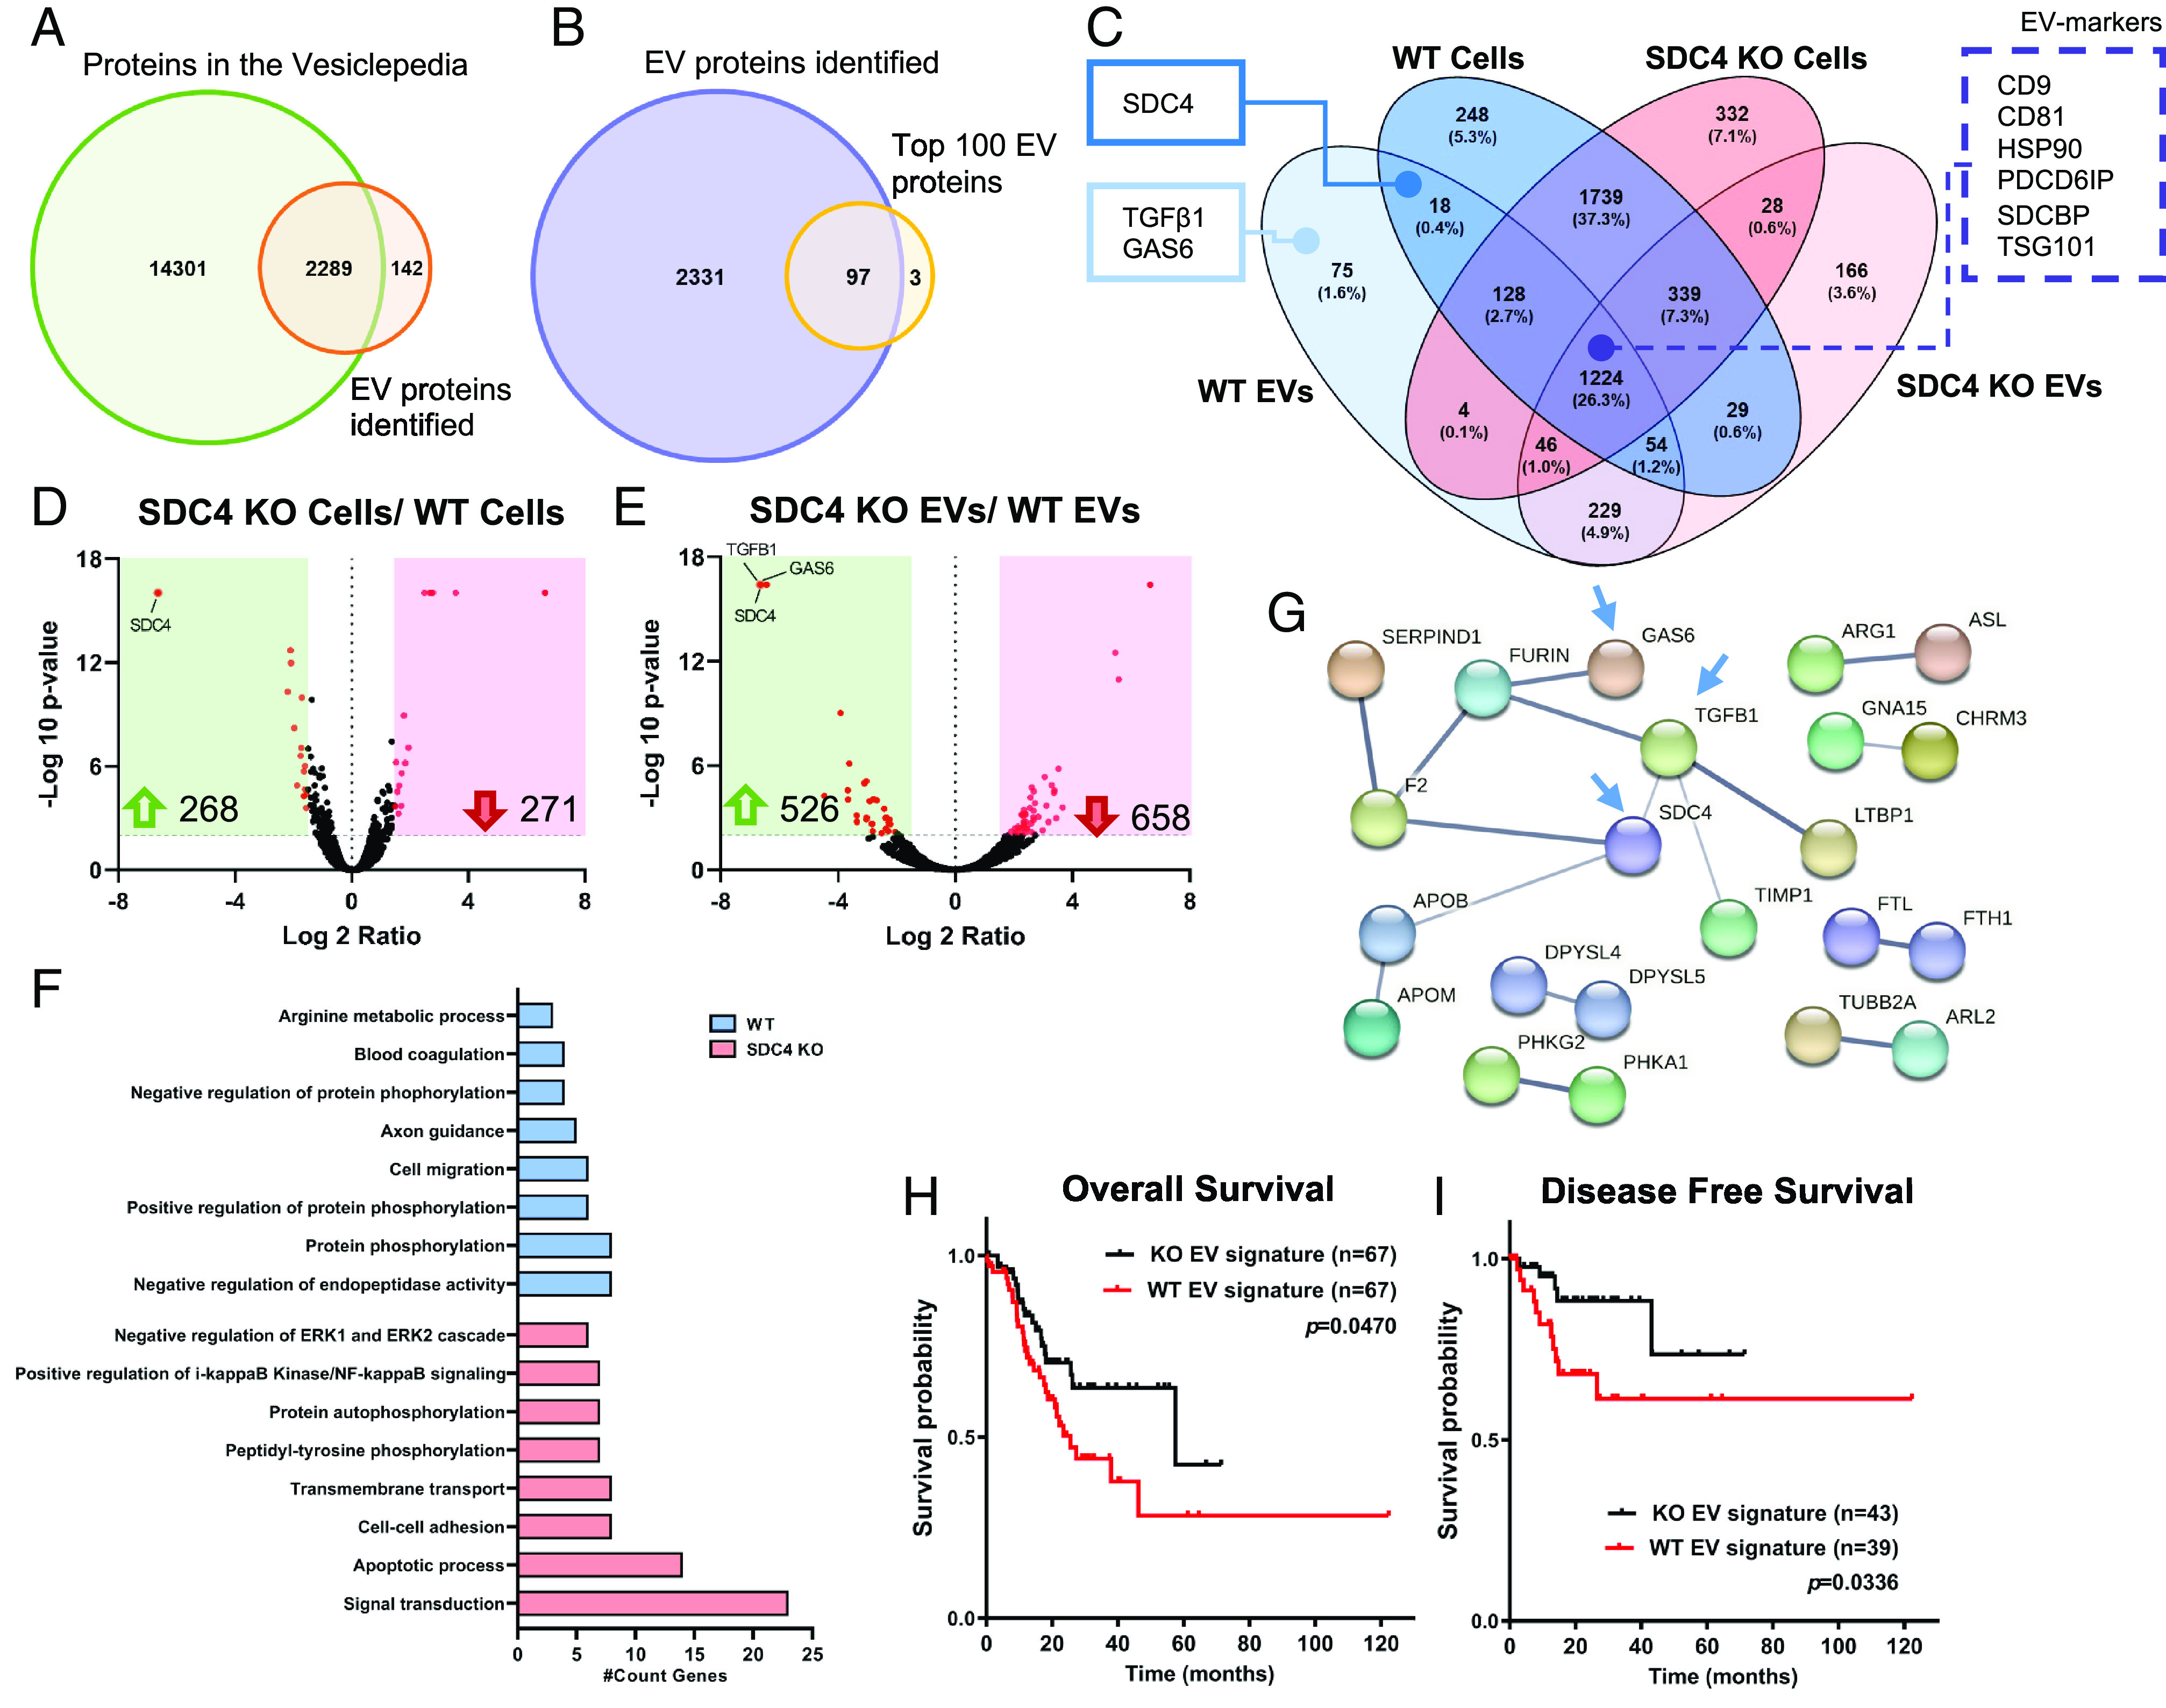
Fig. 4.

SDC4 impacts EVs proteomic signature. Protein identification was evaluated by LC-MS/MS proteomic analysis. (A) Venn diagram displays the number of unique and overlapping proteins identified in this study for WT and KO EVs, comparing to all proteins deposited in the Vesiclepedia database (1). (B) Venn diagram shows comparative analysis between the EV proteins detected in this study and the Top100 EV proteins described in the Vesiclepedia. (C) Venn diagram illustrates the number (and percentage) of the unique and overlapping proteins from WT and KO cell and EV populations. Two key cancer-related proteins and SDC4 are highlighted in full line box, as well, EV-markers are highlighted in dashed line box. (D and E) Volcano plot analysis displaying differentially expressed proteins (red dots) when comparing the protein cargo of (D) KO vs. WT cells and (E) KO vs. WT EVs. Each protein is represented as a dot and is mapped according to its fold change on the x axis, and the P-value on the y axis. Red dots indicate proteins exhibiting significantly altered expression [−Log10 (p-value) > 2 and Log 2 ratio < −1.5 or >1.5], and black dots indicate proteins whose expression did not vary significantly. The number of proteins up-regulated (green arrow) and down-regulated (red arrow) are highlighted. (F) Functionally grouped network of gene ontology (GO) biological process terms for the exclusive proteome in WT and KO EVs (Benjamini P < 0.01). (G) Protein–protein interaction for the SDC4-specific proteome in WT EVs. Blue arrows point to SDC4, GAS6 and TGFβ1. (H and I) In silico analysis of the prognostic value of WT and KO EV signatures. Analysis of (H) OS and (I) DFS was assessed using the STAD-TCGA database. Reference: 1. Kalra H, Simpson RJ, Ji H, Aikawa E, Altevogt P, Askenase P, et al. Vesiclepedia: A Compendium for Extracellular Vesicles with Continuous Community Annotation. PLOS Biology. 2012;10(12):e1001450.
