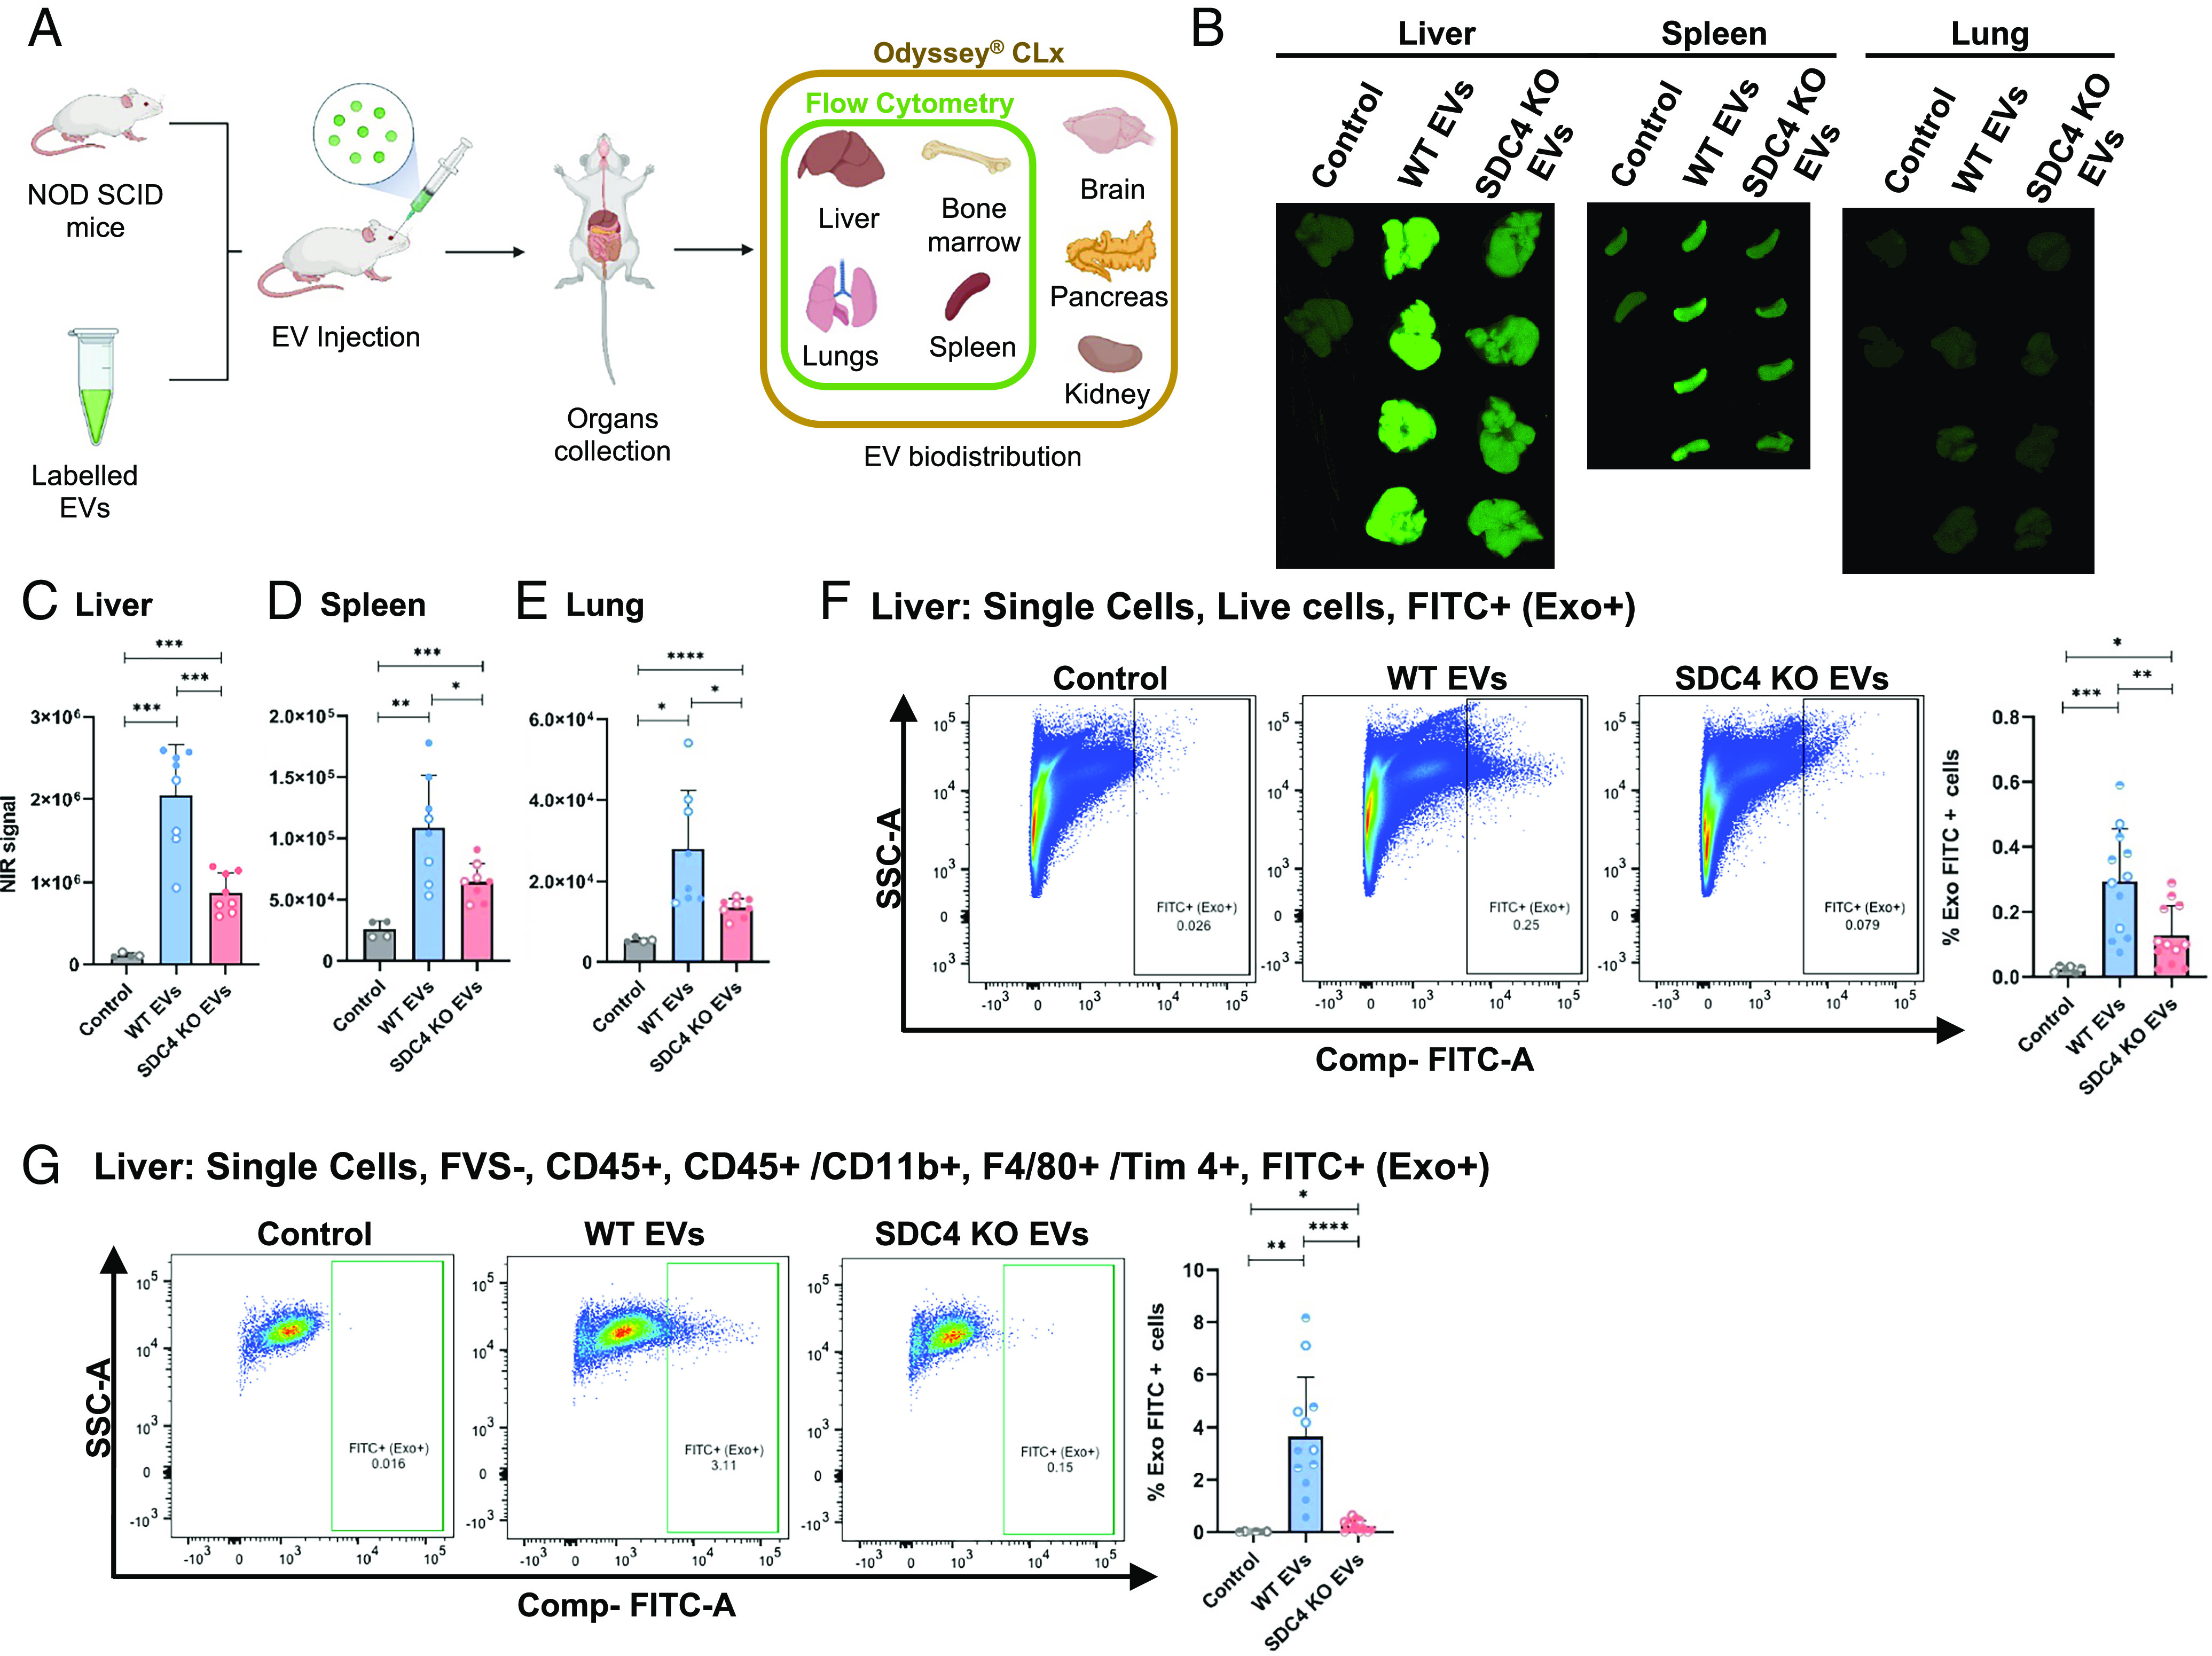
Fig. 6.

SDC4 impacts EVs organ distribution. (A) Schematic representation of the experimental design. (B) EV organ distribution in NOD SCID mice by measurement of NIR fluorescence. Quantification of NIR signaling in (C) liver, (D) spleen and (E) lung. Bar graphs represent the average of fluorescence quantification ± SD. Data from two independent biological replicates for WT and KO EVs (each n = 4, per condition group), and for control (n = 2). (F and G) FACS analysis of liver cells collected from mice injected with PKH67-labeled WT and KO EVs: (F) all live FITC+ (Exo+) cells and (G) all CD45+/CD11b+, F4/80+ Tim4+, FITC+ (Exo+) cells. Bar graphs represent the average of the percentage of cells that incorporated EVs. Data from three independent biological replicates for WT and KO EVs (each n = 4, per condition group), and for control (each n = 2). Statistical significance was assessed using Student’s t test. *P ≤ 0.05; **P < 0.01; ***P < 0.001; ****P < 0.0001.
