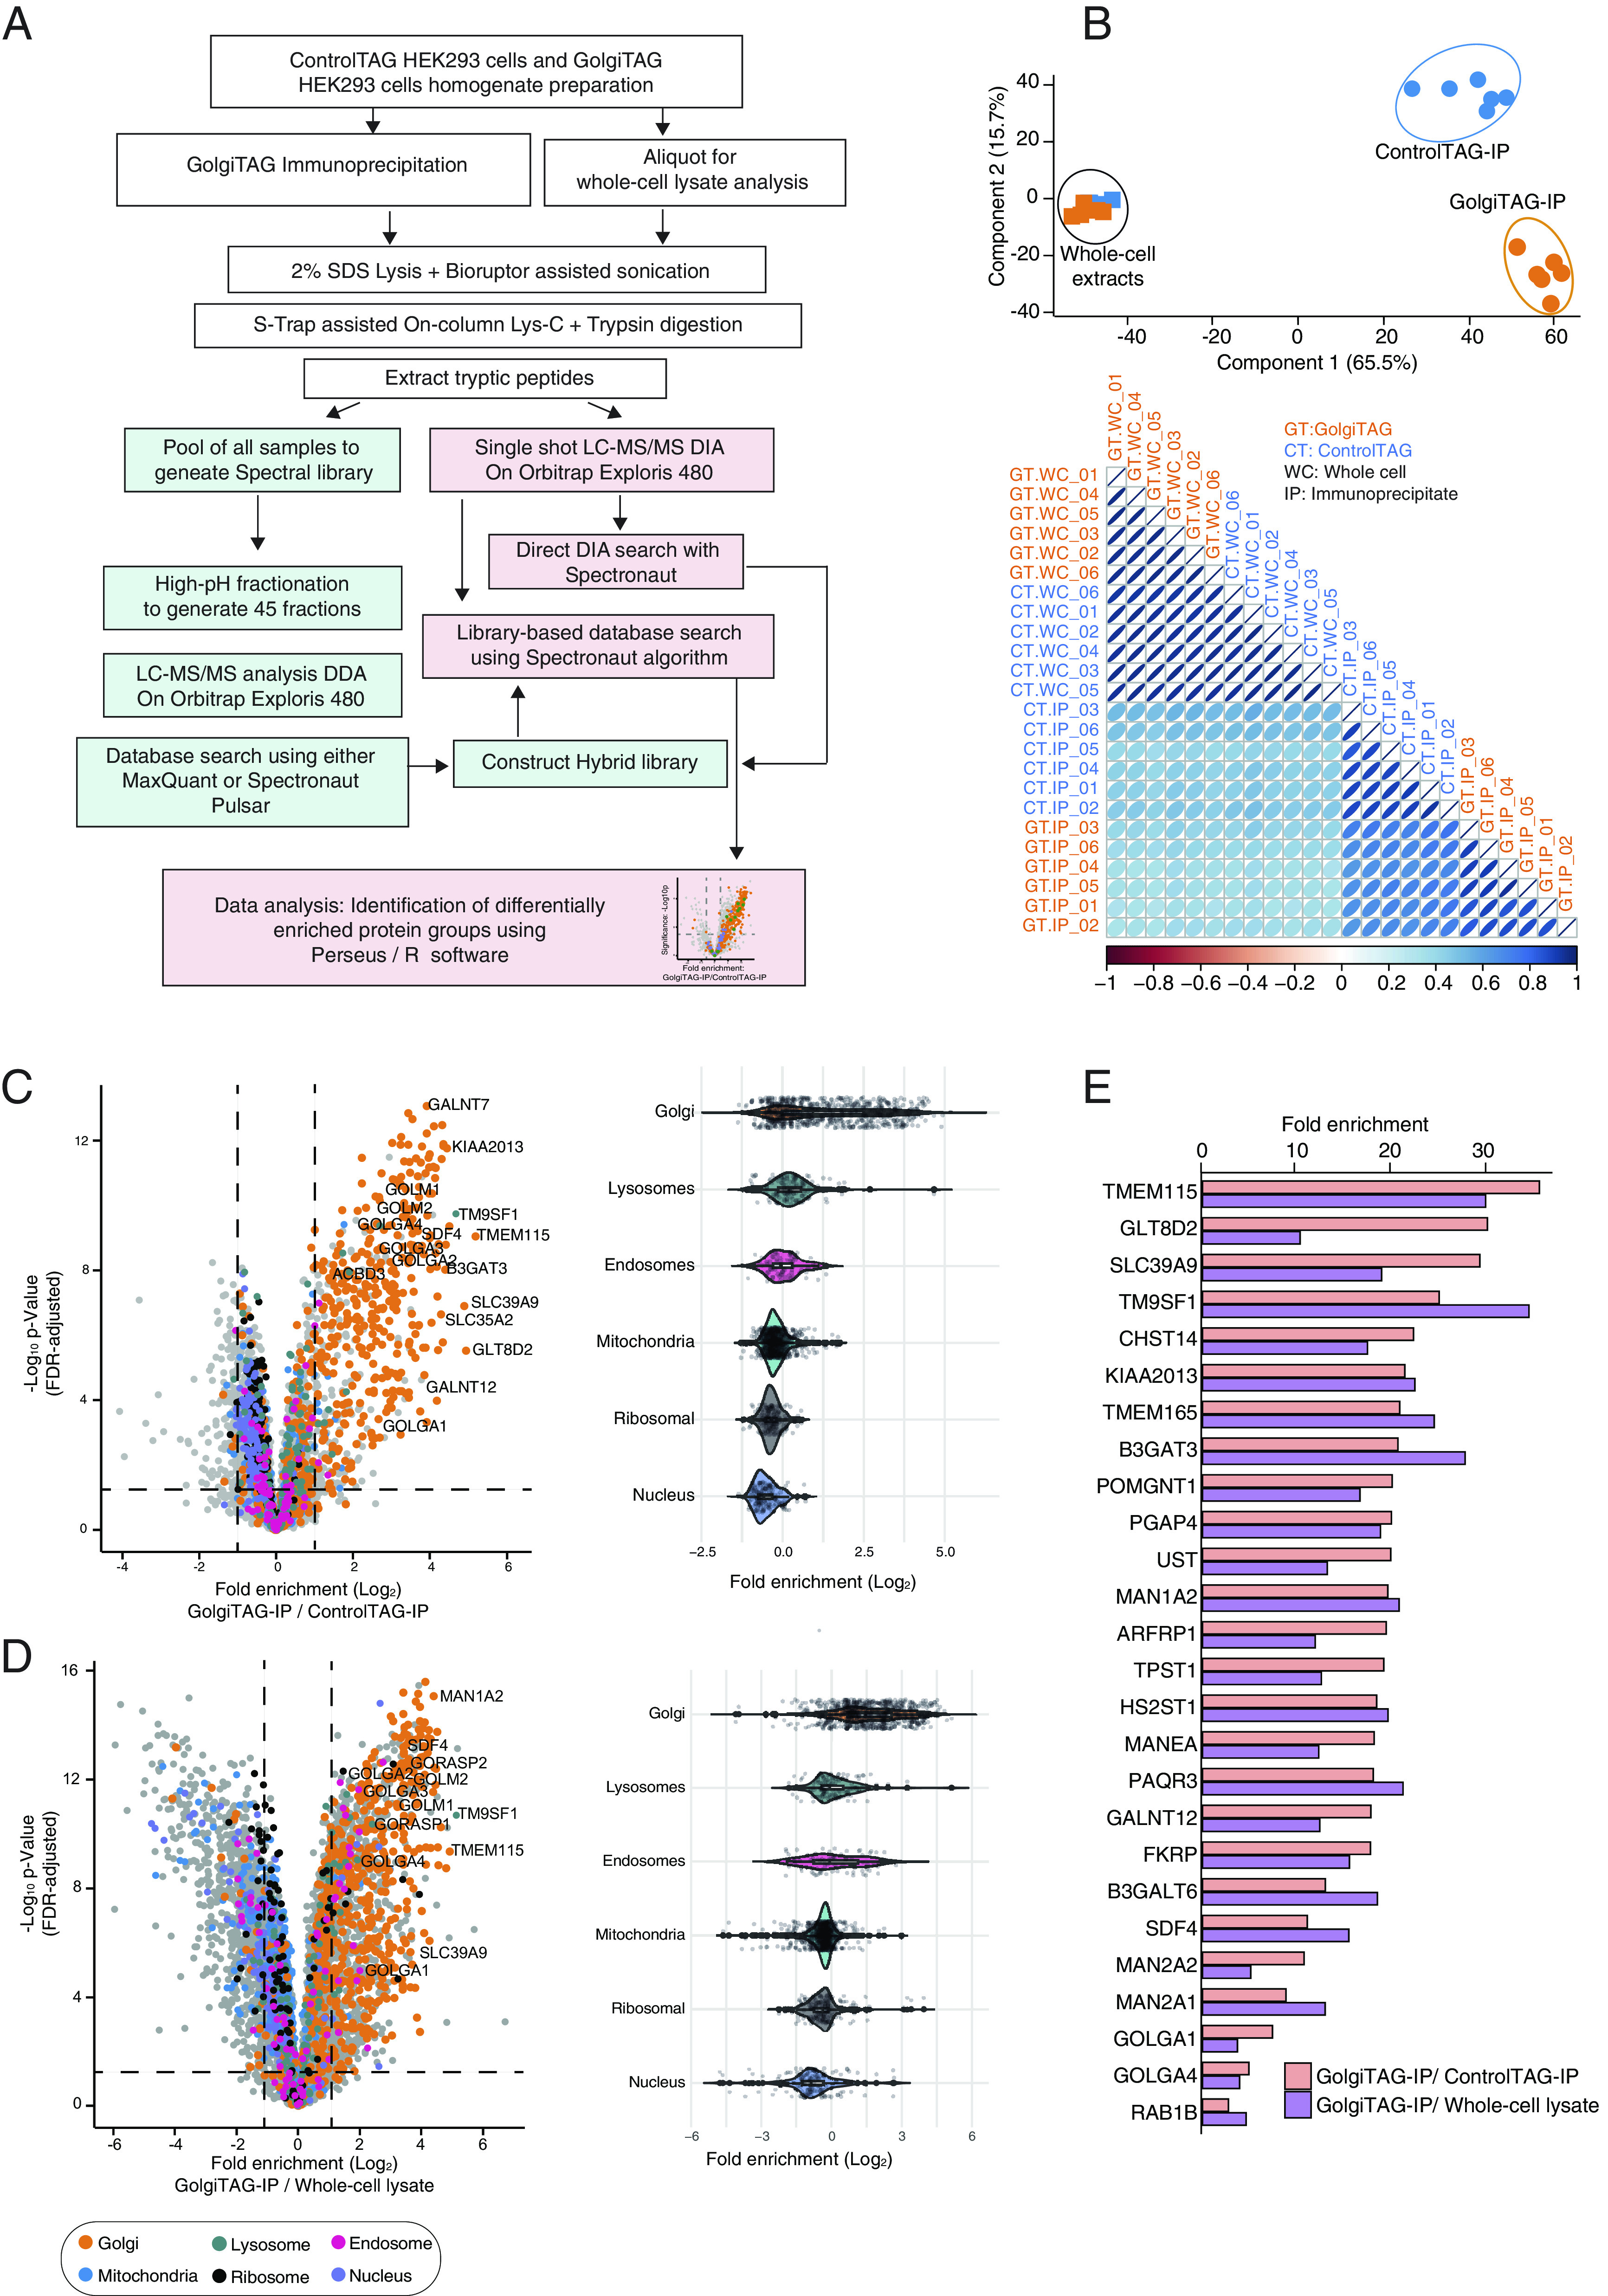
Fig. 2.

Quantitative proteomic analysis of Golgi derived from HEK293 cells. (A) Depiction of the workflow of the data-independent acquisition (DIA)-based mass spectrometry analysis of whole-cell lysates and HA immunoprecipitates (IPs) from control and GolgiTAG expressing HEK293 cells n = 6. (B) Principal component analysis of DIA mass spectrometry data of whole-cell lysates (squares) and IPs (circle) from the control (blue) and GolgiTAG expressing HEK293 cells (orange) (Upper). Lower panel presents a global Pearson’s correlation of proteomics data of all samples. The control immunoblots for this experiment are presented in SI Appendix, Fig. S2A. (C) Volcano plot of the fold enrichment of proteins between IPs from GolgiTAG and control HEK293 cells (n = 6 P-value adjusted for 1% permutation-based FDR correction, s0 = 0.1) (Left). Selected well-studied Golgi proteins are denoted with gene names. The orange dots indicate known Golgi-annotated proteins curated from databases described in Dataset S3. Proteins associated with the lysosome, endosome, mitochondria, ribosome, and nucleus are indicated with the colors represented below the volcano plot. The adjacent violin plots (Right) represent the relative fold enrichment of the proteins associated with indicated organelles. (D) As in (C) except that the fold enrichment in protein abundances was calculated by comparing the IP fraction and the whole-cell lysate of GolgiTAG cells. (E) Bar graph presentation of the relative fold enrichment of top 26 proteins enriched in the IP fraction from GolgiTAG cells compared to those from ControlTAG cells (orange) or to whole-cell lysate from GolgiTAG cells (purple).
