Fig. 5.

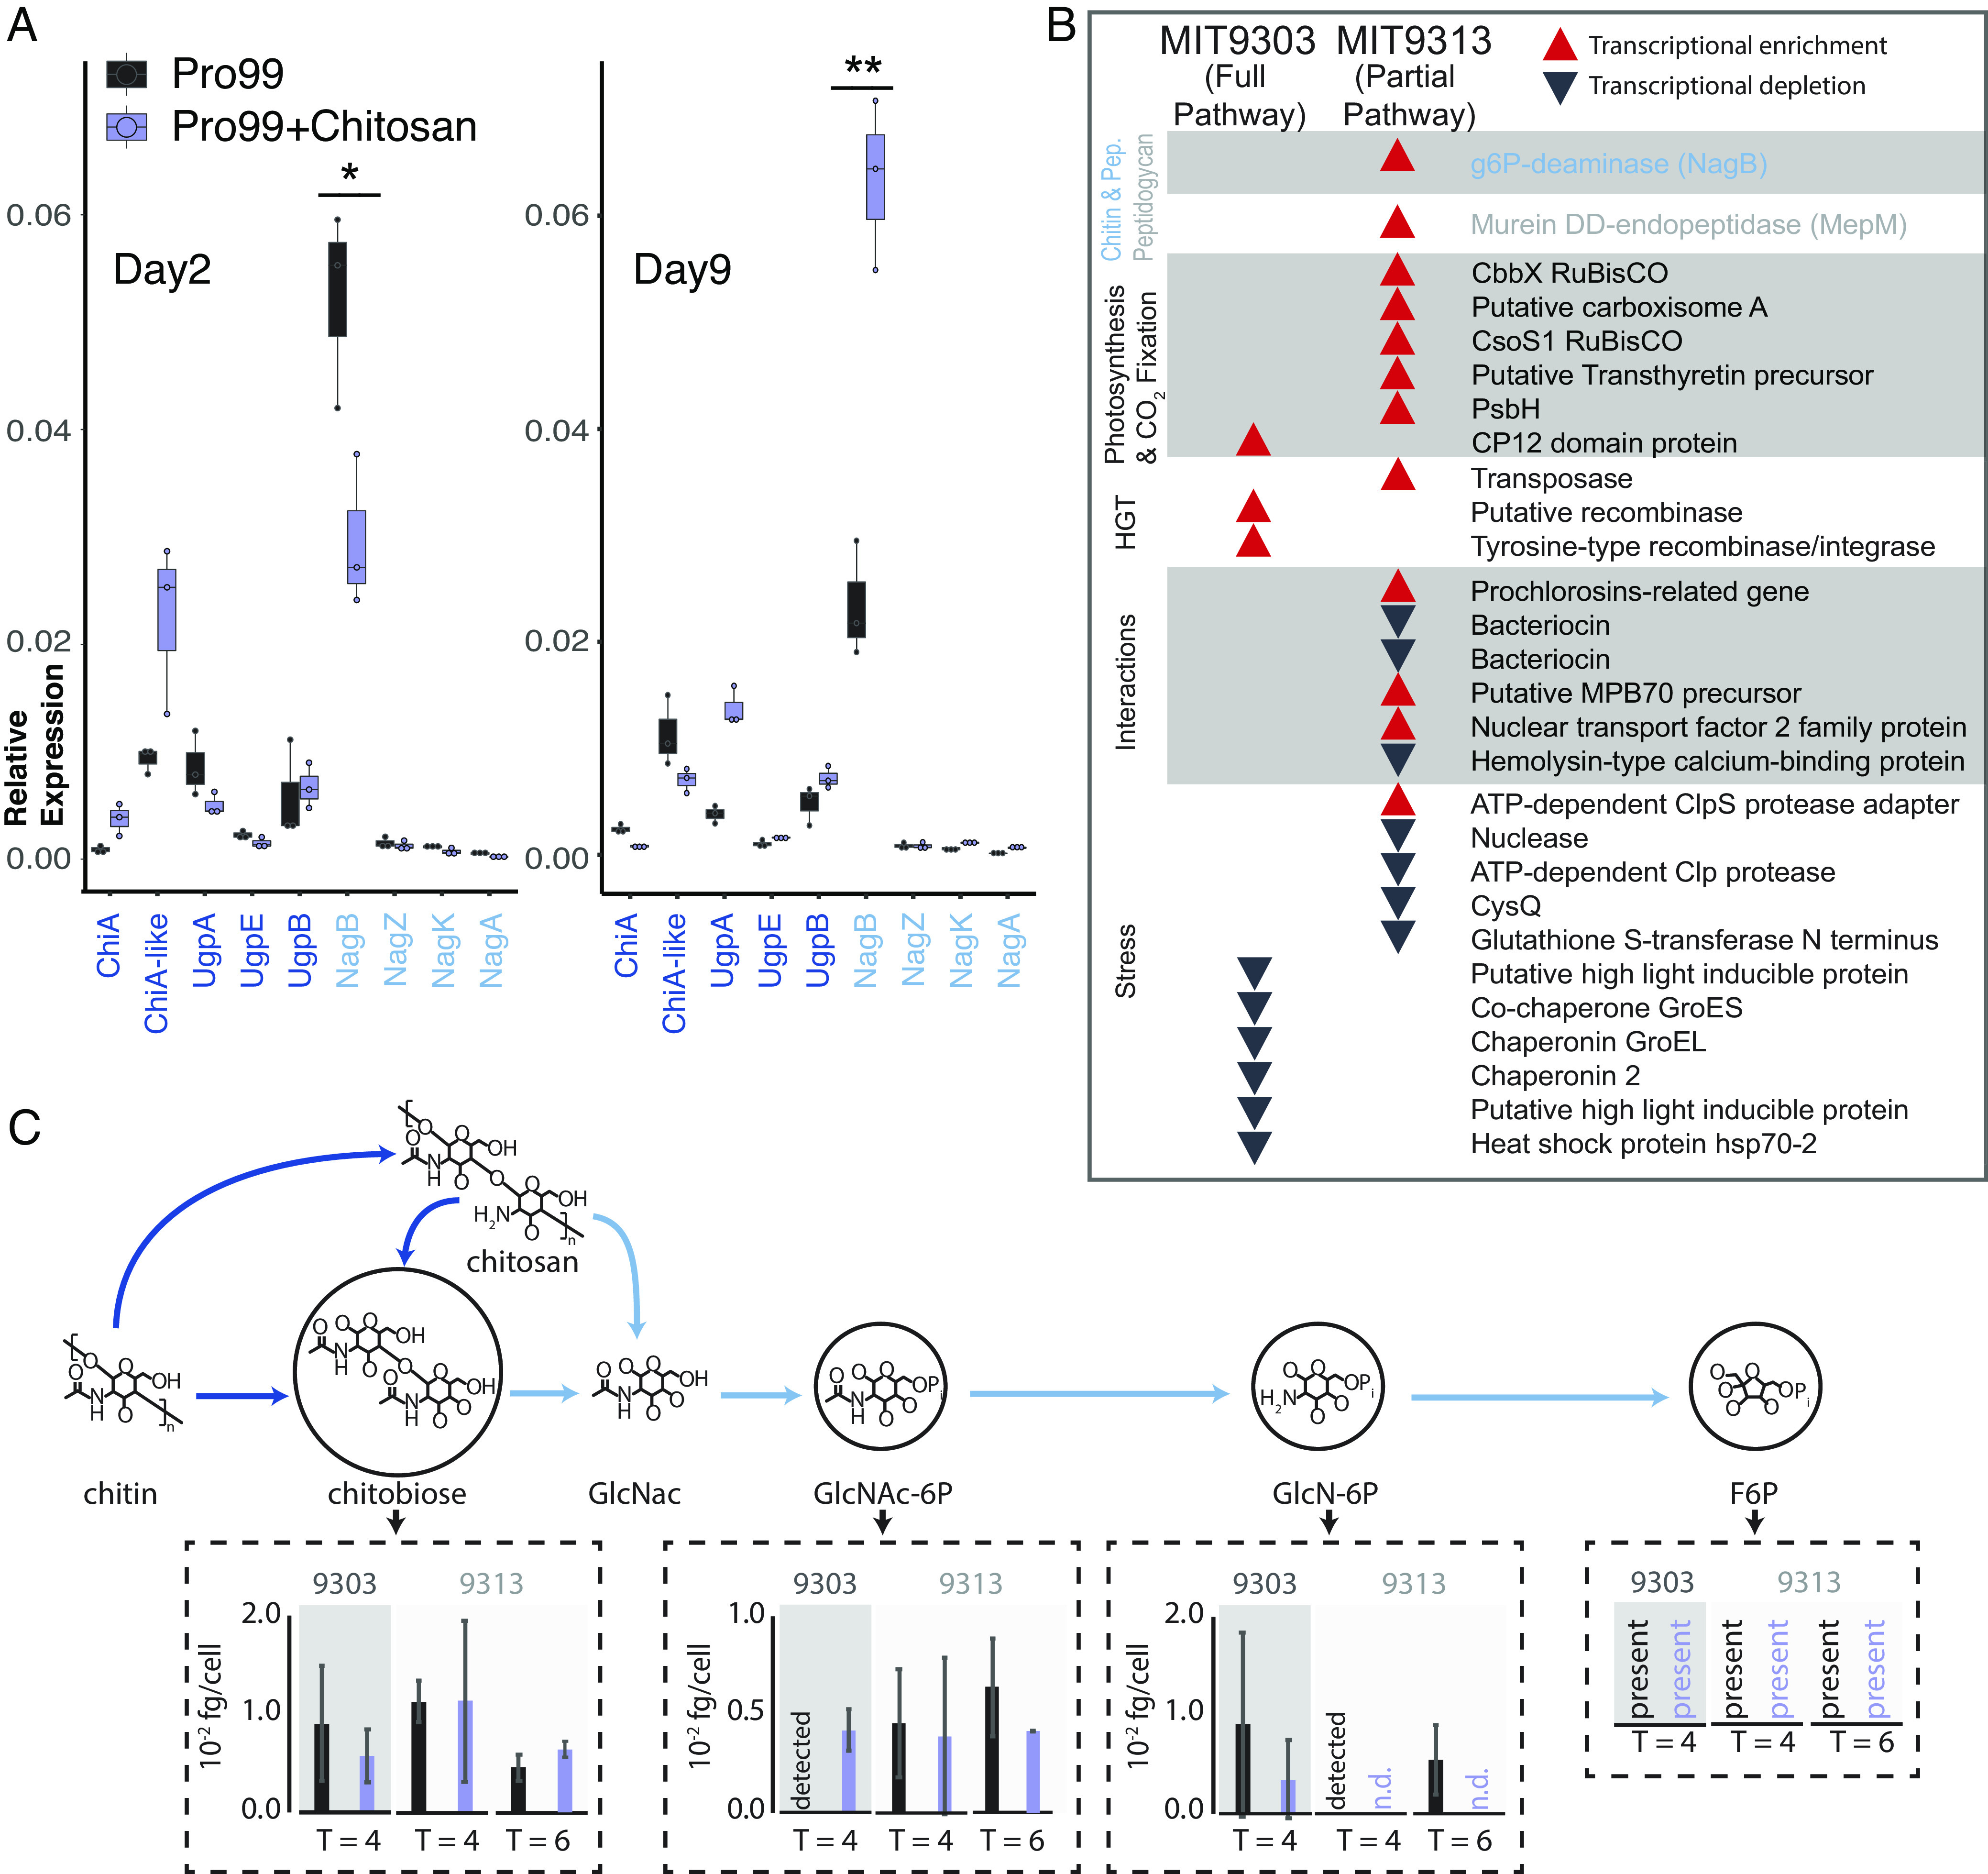
Gene expression and metabolomic analysis in Prochlorococcus in response to the addition of chitosan. (A) Expression (measured by qPCR) of all the chitin-related genes in MIT9303 (primary degrader) in relation to the housekeeping gene, rnpB, gene in natural seawater-based Pro99 medium in presence and absence of chitosan at two time points over the growth curve. Cells were in early exponential growth on day 2 and mid-exponential on day 9. *P < 0.05, **P < 0.01. (B) Qualitative representation of the relative expression of genes (measured using RNA-Seq) in the two Prochlorococcus strains 24 h after addition of chitosan (SI Appendix, Fig. S6). Red upward pointing arrows represent statistically significant transcript enrichment in presence of chitosan while black downward pointing arrows represent statistically significant transcript depletion. Genes are grouped by functional categories, which are shown in shaded/unshaded sections. (C) Concentrations of intermediates of chitin degradation on days 4 and 6 after chitosan additions (purple) compared to unamended controls (black). Error bars show the SDs of three biological replicates for MIT9303 and MIT9313 on day 4, and of two replicates for MIT9313 on day 6. Molecular abbreviations and color scheme is the same as in Fig. 1. Metabolites are labeled as “detected” in samples where they were observed in only a single replicate, and as “n.d.” (not detected) in samples where they were not observed in any replicates. Fructose-6-P was present in most samples, but its levels could not be quantified due to interference by the organic carbon matrix.
