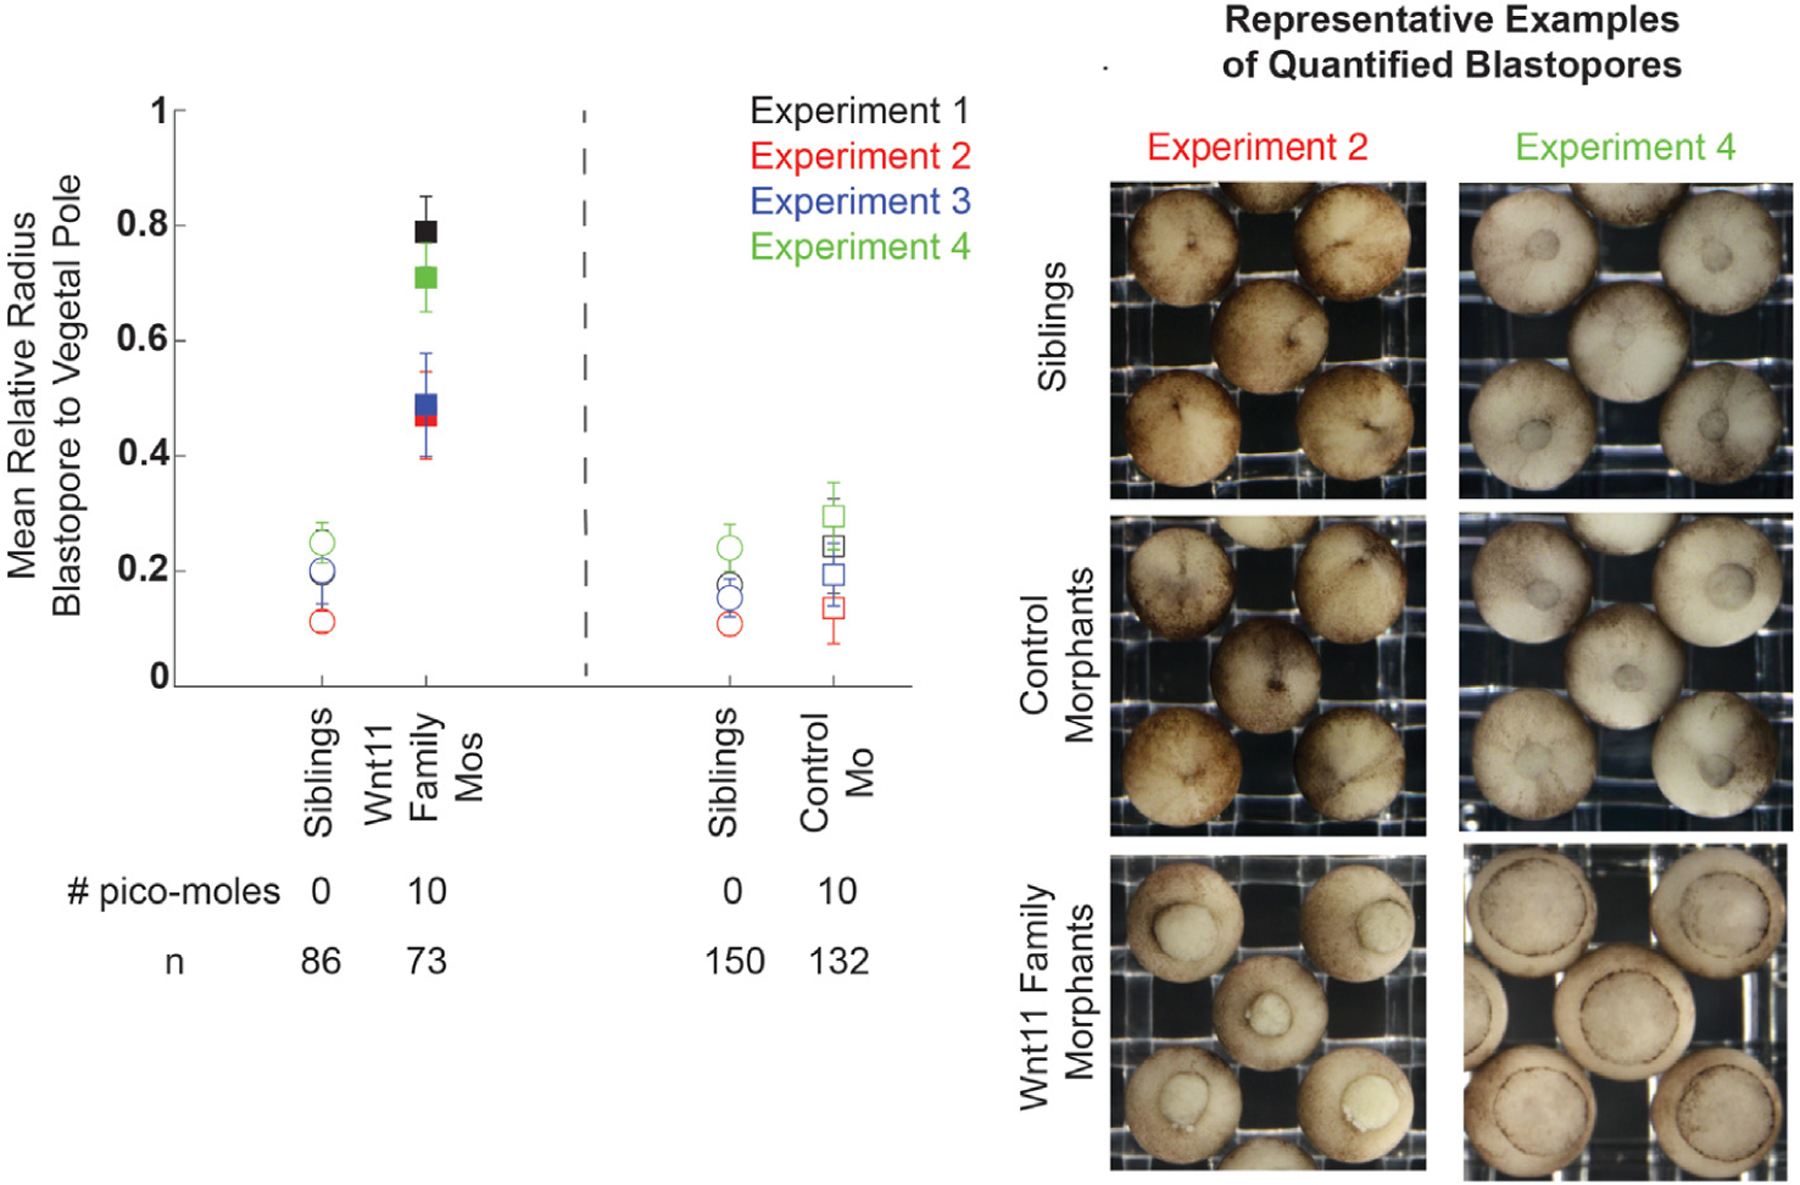
Fig. 3. Wnt11 family morphants embryos have larger blastopores at the end of gastrulation than control morphants and siblings.

For four biological replicates, embryos were injected with 10 pmol total of either Wnt11 family morpholinos or the control morpholino in both blastomeres at the 2-cell stage. The relative radius of the blastopore to the embryo was quantified using FIJI processing of still images taken when siblings embryos were at Stage 12.5. The difference in relative blastopore radius was statistically significant for all replicates. The sample mean and standard deviation are shown for all biological replicates and experimental conditions. Statistical significance of the difference between the experimental injections and standard control morpholino injection values for each clutch was determined with the student’s t-test, and statistically significant perturbation have filled in markers. Multiple hypothesis testing was corrected for using the Bonferroni Method. Representative example blastopores from the different conditions are shown for two biological replicates.
