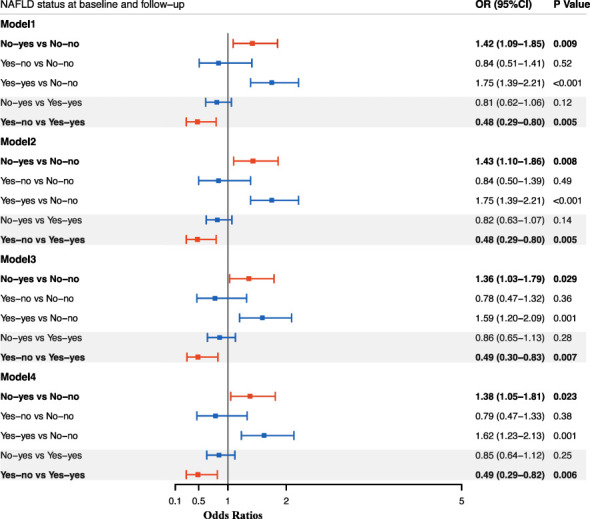
Figure 1.

Odds ratios for incident diabetes according to change in NAFLD status between baseline and follow-up. Data are presented as Odds ratios (ORs), and the corresponding 95%CI in each group. Logistic regression models were used to estimate the ORs, 95% CIs, and P values. Model 1: adjusted for age, gender; Model 2: adjusted for age, gender, smoking and drinking status; Model 2: adjusted for age, gender, smoking and drinking status, baseline BMI; Model 4: adjusted for age, gender, smoking and drinking status, baseline WC. No-yes: absence of NAFLD at baseline but presence of NAFLD at follow-up; No-no: absence of NAFLD at baseline till the follow-up; Yes-no: presence of NAFLD at baseline but absence of NAFLD at follow-up; Yes-yes: presence of NAFLD at baseline till the follow-up.
