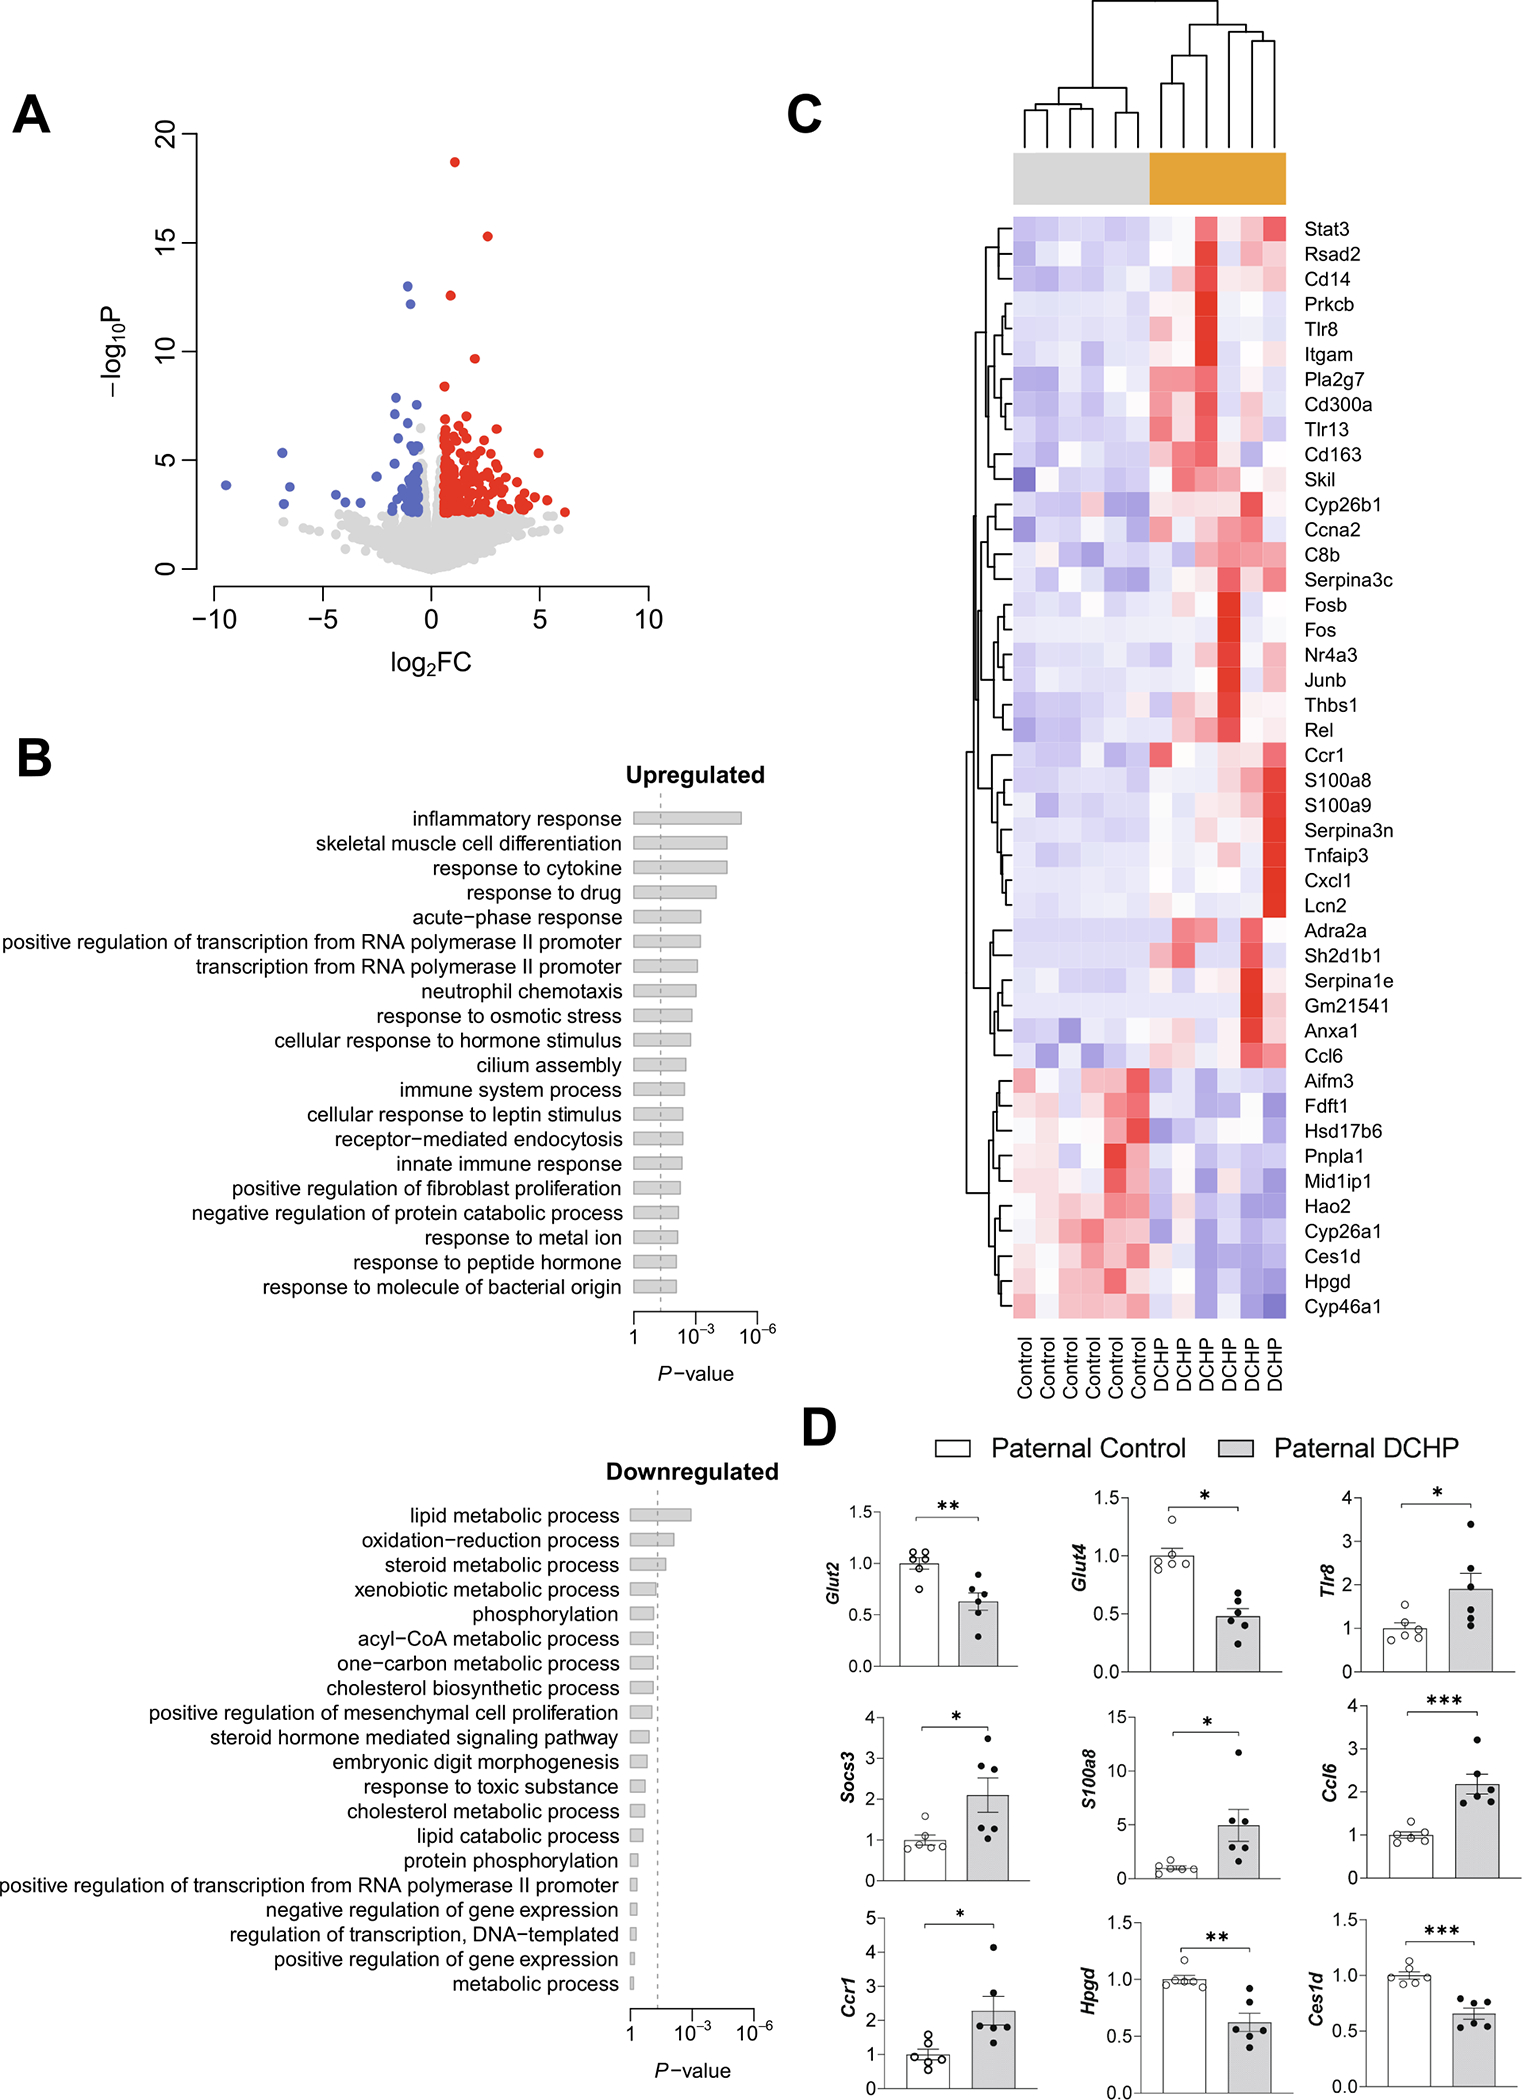
Fig. 4. Paternal DCHP exposure alters hepatic transcriptome in F1 male offspring.

Eight-week-old male WT mice were treated with vehicle control or 10 mg/kg/day of DCHP by oral gavage for 4 weeks. F1 descendants of control or DCHP-exposed sires were fed a HFD for 9 weeks. Total RNAs were extracted from the liver of F1 male mice for RNA-seq analysis. (A) Volcano plot of differentially expressed genes (DEGs) between F1 descendants of DCHP-exposed sires and F1 descendants of control sires. Colored dots represent the up-regulated (red) and down-regulated (blue) hepatic DEGs of F1 offspring with a false discovery rate (FDR) < 0.1 and a fold change (FC) > 1.5 as a cut-off threshold. (B) Gene Ontology (GO) Biological Process terms associated with the hepatic DEGs of F1 offspring. The P-values were computed by Fisher’s exact test. The vertical dash line indicates the significance level of α = 0.05. The y-axis displays the GO terms while the x-axis displays the adjusted P-values. (C) Heatmap representation of DEGs involved in the GO Biological Processes of “inflammatory response”, “lipid metabolism process”, “cellular response to leptin stimulus”, “immune system process”, “oxidation–reduction process’, “neutrophil chemotaxis”, “response to cytokine’, and “ cellular response to hormone stimulus” shown in panel B. Each row shows one individual genes and each column shows a biological replicate of mouse. Red represents relatively increased gene expression while blue denotes downregulation. (D) QPCR analyses of representative hepatic genes of F1 offspring (n = 6, two-sample, two tailed Student’s t-test, *P < 0.05, **P < 0.01, and ***P < 0.01). (For interpretation of the references to colour in this figure legend, the reader is referred to the web version of this article.)
