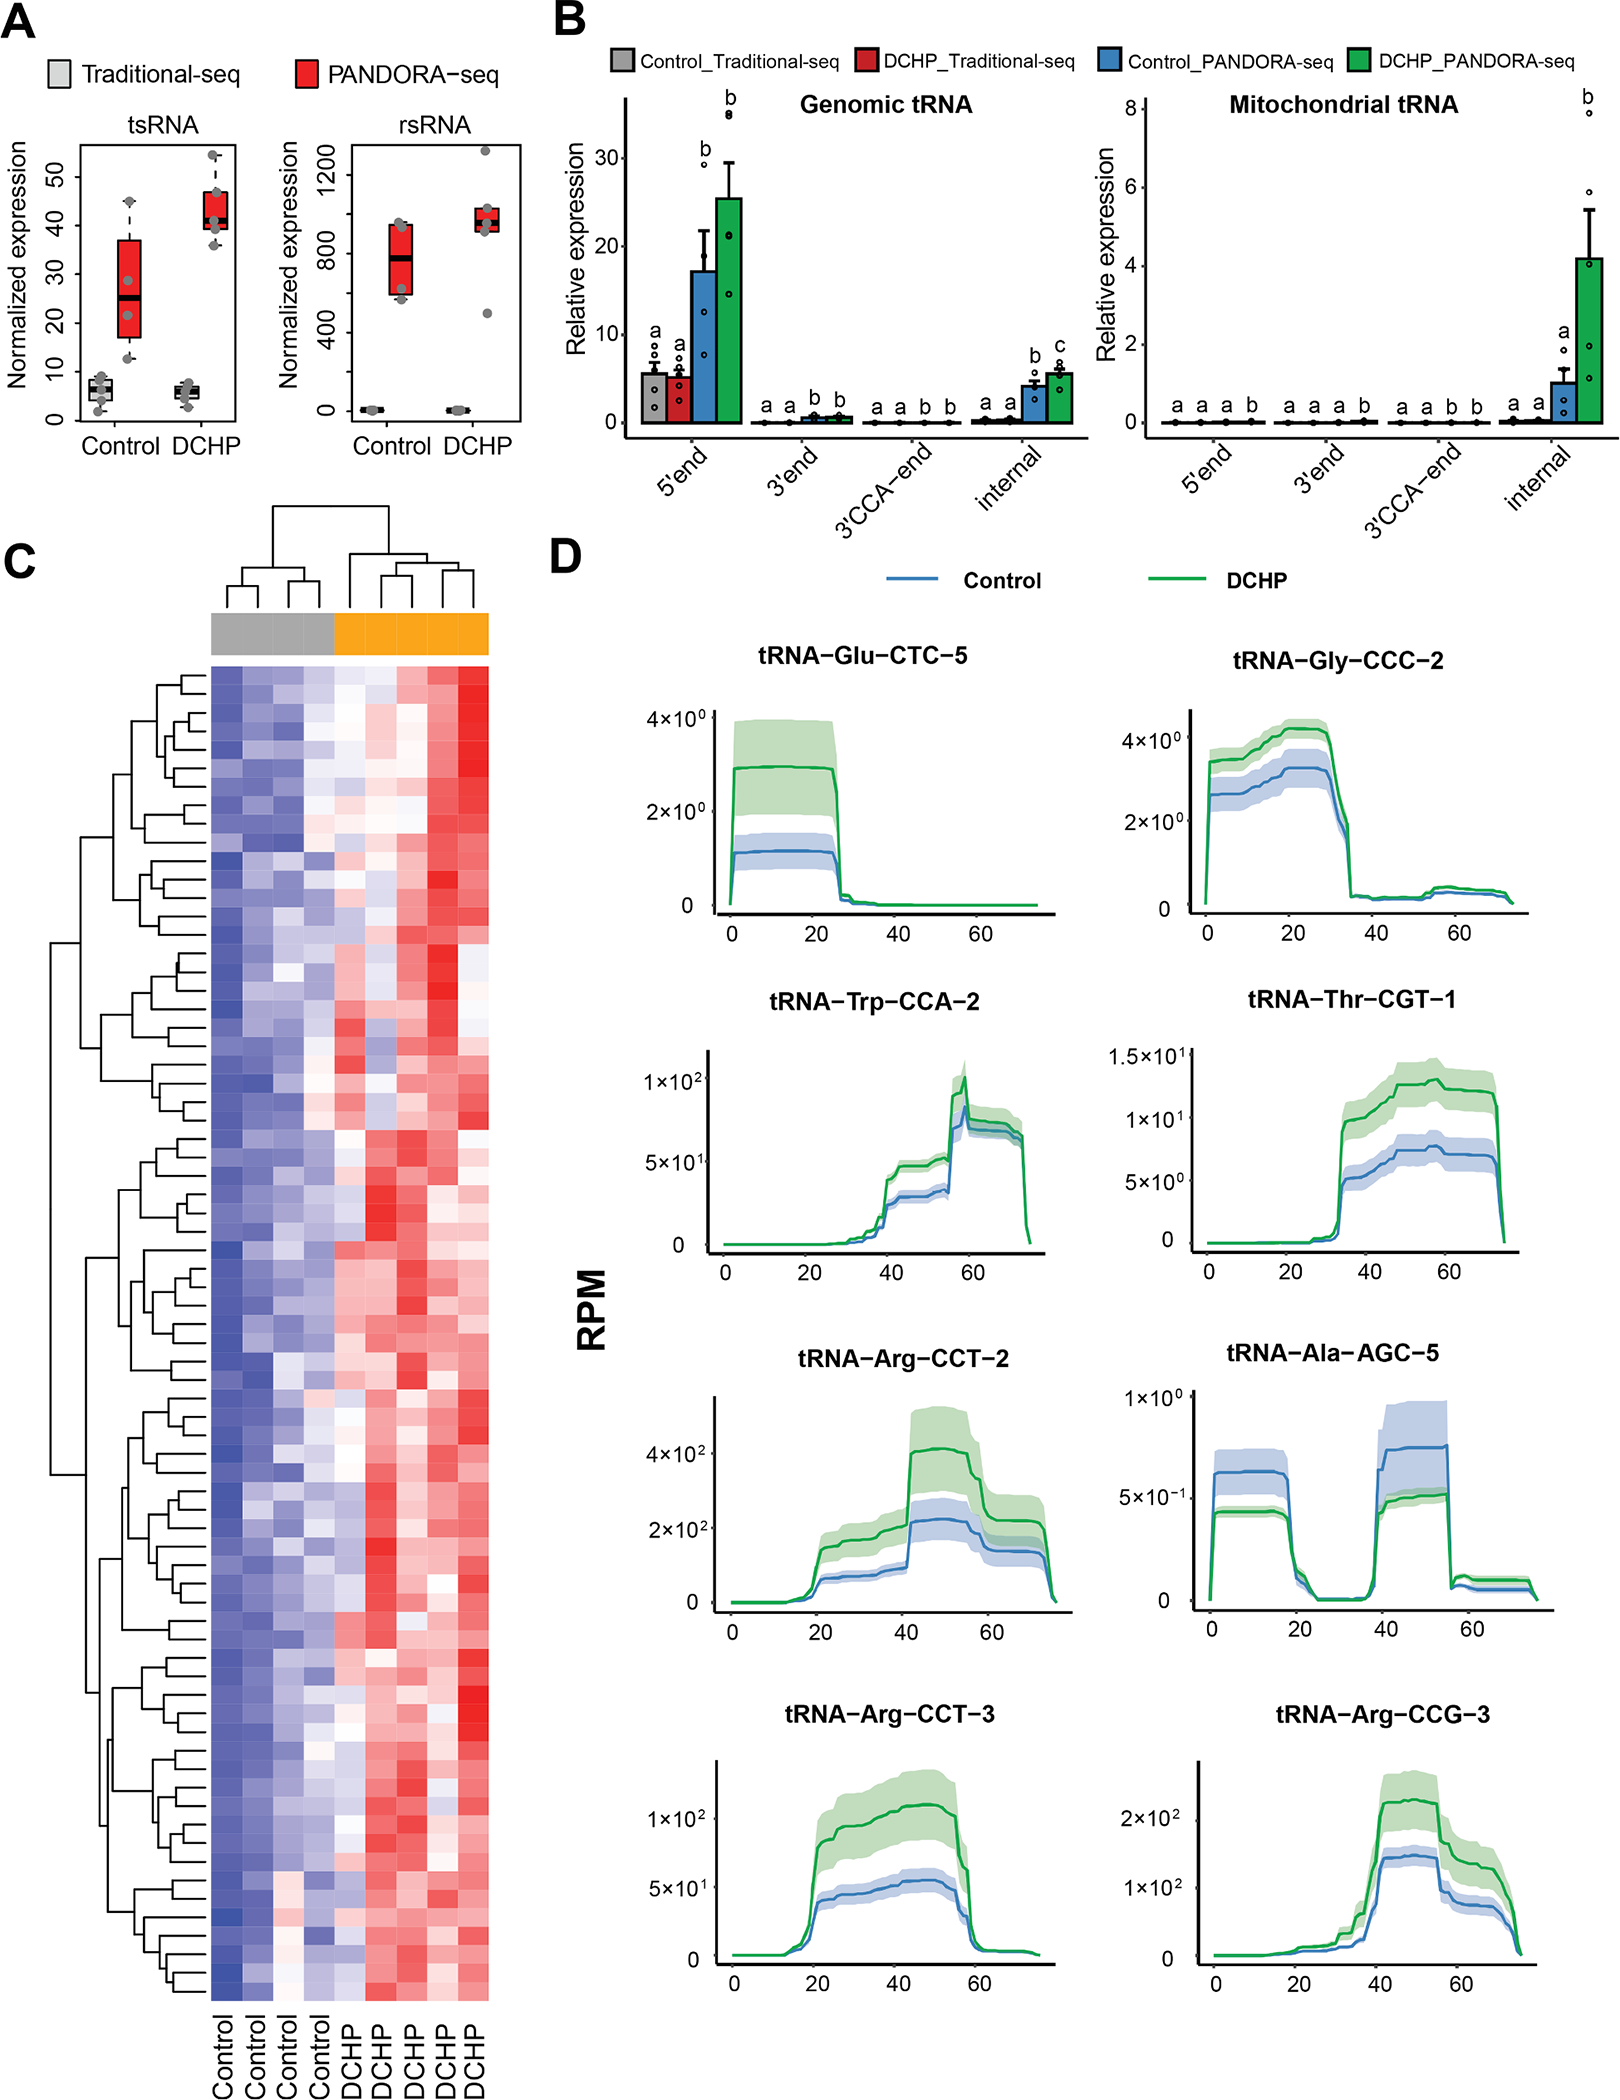
Fig. 5. PANDORA-seq identifies significantly changed tsRNAs and rsRNAs in the sperm of DCHP treated sires.

Eight-week-old male WT mice were treated with vehicle control or 10 mg/kg/day of DCHP by oral gavage for 4 weeks. Total RNAs were isolated from the sperms of F0 male mice and used for PANDORA-seq or traditional small RNA sequencing. (A) Normalized tsRNA and rsRNA (normalized to miRNAs) under traditional-seq and PANDORA-seq protocols. (B) tsRNA responses to traditional-seq and PANDORA-seq corresponding to different origins (5′ tsRNA, 3′ tsRNA, 3′ tsRNA-CCA end, and internal tsRNAs). The y axes represent the relative expression levels compared with total reads of miRNAs. Statistical significance was determined by two-sided one-way ANOVA with uncorrected Fisher’s LSD test. Bars bearing different letters above were significantly different from each other (P < 0.05). All data are plotted as means ± SEM (n = 4–5 in each group). (C) Relative expression heatmap of the differentially expressed tsRNAs and rsRNAs in the sperm of control or DCHP-exposed mice detected by PANDORA-seq (n = 4–5). Each row shows one individual tsRNA or rsRNA and each column shows a biological replicate of mouse. Red represents higher relative expression while blue denotes lower relative expression. (D) Dynamic responses to vehicle control or DCHP of representative individual tsRNAs detected by PANDORA-seq. The solid curves indicate the mean reads per million (RPM) values for the control and DCHP-exposed groups. The colored bands represent the 95 % confidence interval (n = 4–5). (For interpretation of the references to colour in this figure legend, the reader is referred to the web version of this article.)
