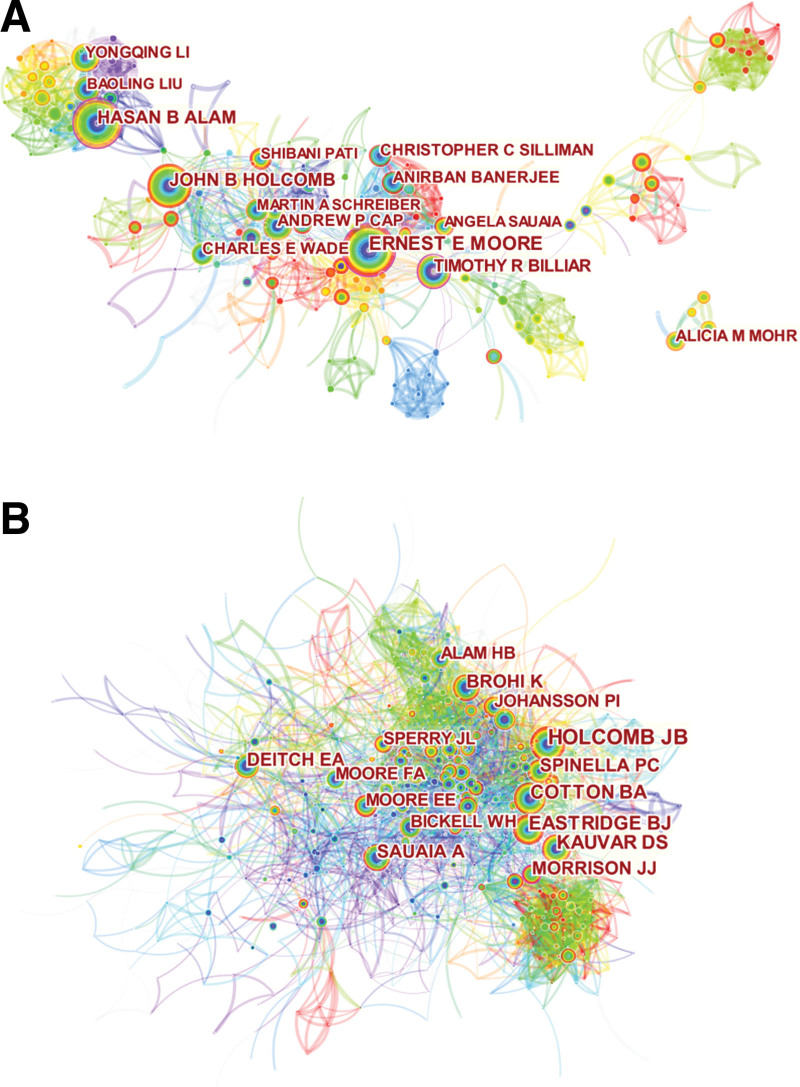
Figure 3.
Visual analysis of (A) authors and (B) co-cited authors. The node size represents the number of studies published by the author, with larger nodes representing a higher number of published papers. The closer the collaboration between 2 writers, the shorter the distance between the 2 nodes. The purple nodes represent early publications, while the red nodes represent recent or bursts of published articles.

