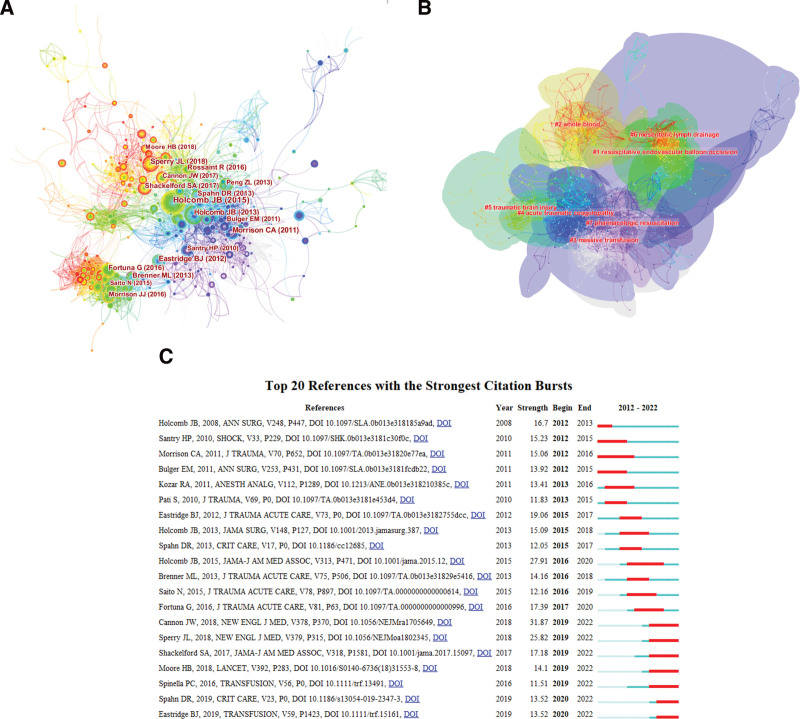
Figure 5.
Visual analysis of (A) co-citations, (B) clustering networks, and (C) reference bursts. Each circle represents a reference. The size of the circle is proportional to the citation’s frequency. The link between the 2 circles represents 2 references cited in the same article among the cited articles. Similarly, line thickness is positively correlated with co-citation frequency.

