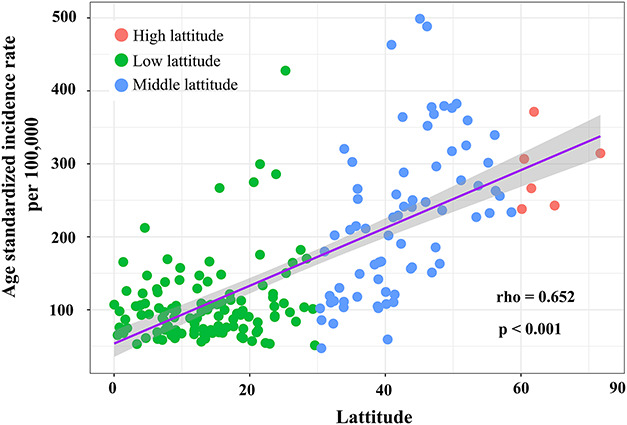
Fig. 2.

This figure shows the association between the age-standardized incidence rate of hip fractures and the latitudes of each country. We used the latitudes of the capital of each country. The latitudes were divided into three groups: low-latitude region, 0° to 30°; middle-latitude region, 30° to 60°; and high-latitude region, 60°to 90°. We analyzed the association of latitude with the age-standardized rate using Spearman rank-order correlation analysis.
