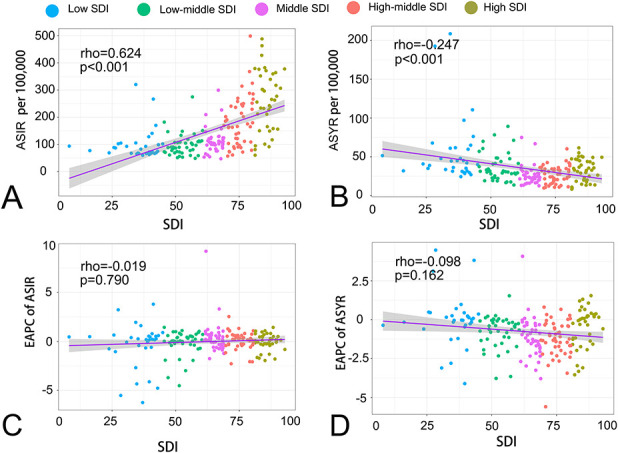
Fig. 5.

These graphs show the correlations between (A) the ASIR and SDI, (B) age-standardized YLD rate and SDI, (C) EAPC of the age-standardized incidence rate and SDI, and (D) EAPC of the age-standardized YLD rate and SDI. ASIR = age-standardized incidence rate; ASYR = age-standardized YLD rate; YLD = years lived with disability; EAPC = estimated annual percentage change; SDI = sociodemographic index.
