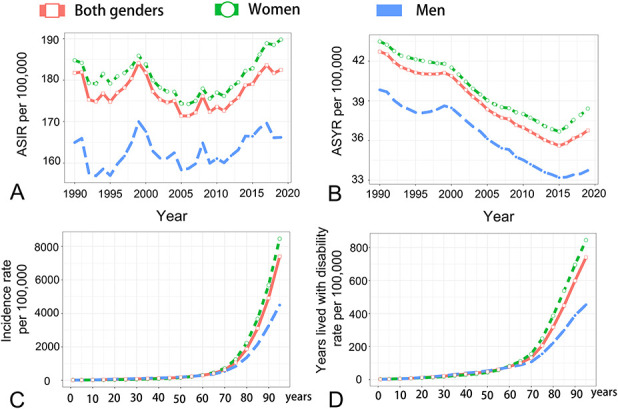
Fig. 6.

These graphs show the age-standardized incidence and YLD rate of hip fractures by age and gender, including (A) the trends in ASIR of hip fractures from 1990 to 2019 by gender, (B) the trends in ASYR of hip fractures from 1990 to 2019 by gender, (C) the incidence rate of hip fractures by age and gender, and (D) the YLD rate of hip fractures by age and gender. ASIR = age-standardized incidence rate; ASYR = age-standardized YLD rate; YLD = years lived with disability.
