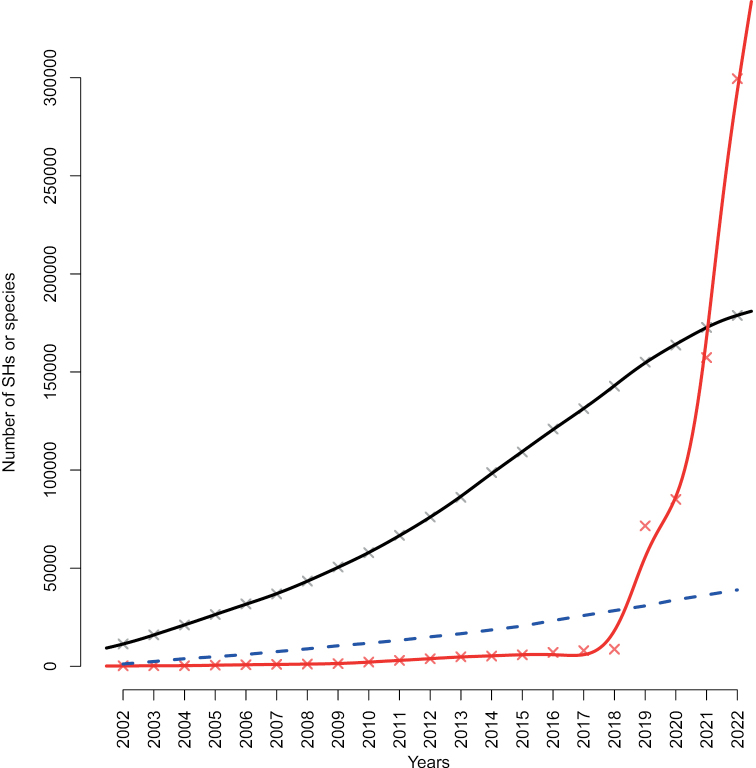
Figure 1.
The accumulation of SHs at the 1.5% distance threshold over time in the Sanger (black; 88,665 studies of various sizes) and the DFT (red; 5 large studies) datasets. The Y axis depicts the number of SHs, and the X axis depicts year of sequence deposition. Solid trend lines were calculated using cubic smoothing splines. Also plotted (blue) is the cumulative number of newly described species for the period 2002–2022 (excluding recombinations, orthographic variants, invalid names, and illegitimate names). The numbers of species described in ca 2020–2022 may be slight underestimates due to widespread violation of the ICN recommendation F.5A to “inform the recognised repository of the complete bibliographic details upon publication of the name”. In reality, also the Sanger (INSDC) dataset is likely to hold some proportion of DFT. DFT sequences are notoriously difficult to tell apart in an automated way from sequences that are unidentified for other reasons (Abarenkov et al. 2022). The present study errs on the side of caution by treating all Sanger sequences as taxonomy-derived, meaning that Fig. 1 presumably under-estimates the proportion of DFT in the underlying data.

