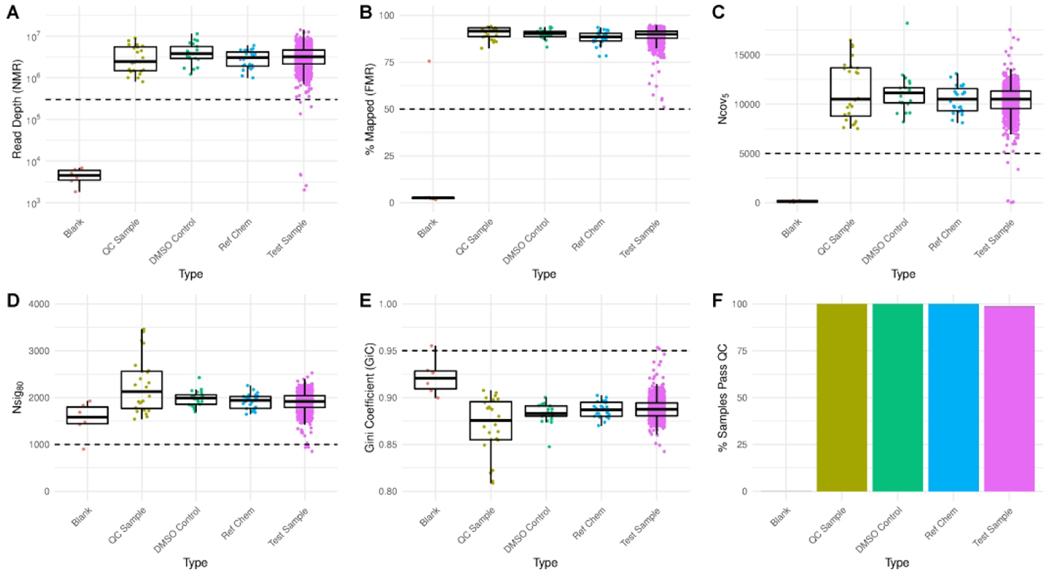
Figure 2. Quality assessment of high-throughput transcriptomics data.
(A-E) Distributions of all sample-level QC metrics, split by sample type. Dashed lines indicate thresholds for masking samples from further analysis. (F) Proportion of samples passing all QC thresholds by type. Blank = Lysis buffer negative controls containing no cellular material; QC Sample = samples prepared in larger batches and added to each plate prior to conduct of TempO-Seq assay; DMSO Control = vehicle control for all other wells; Ref Chem = single dose reference chemical treatments; Test Sample = wells treated with a test chemical.

