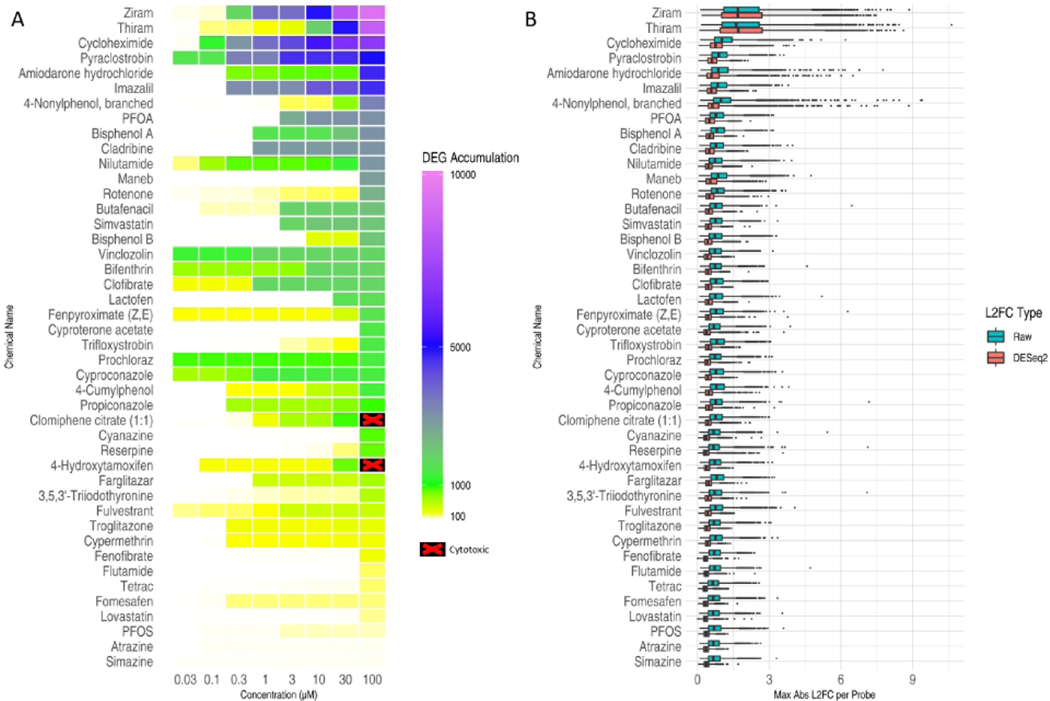
Figure 5. Transcriptional perturbations produced by chemical treatments.
(A) DEG accumulation scores for each test chemical (rows) at each concentration (columns). The color of each cell indicates the number of probes that were significantly differentially expressed at or below the corresponding concentration. Chemical concentrations that were masked from transcriptomic analysis due to cytotoxicity are shown as black with a red ‘X’ on the heatmap. (B) Distribution of gene response effect sizes. For each chemical, the maximum absolute L2FC value was computed for each probe across all concentrations and the distribution for all probes is represented as a boxplot. Blue boxplots indicate the distribution using “raw” L2FCs computed directly from mean log2(CPM) values. Red boxplots indicate the distributions of moderated L2FCs returned by DESeq2 analysis of raw counts across all plates.

