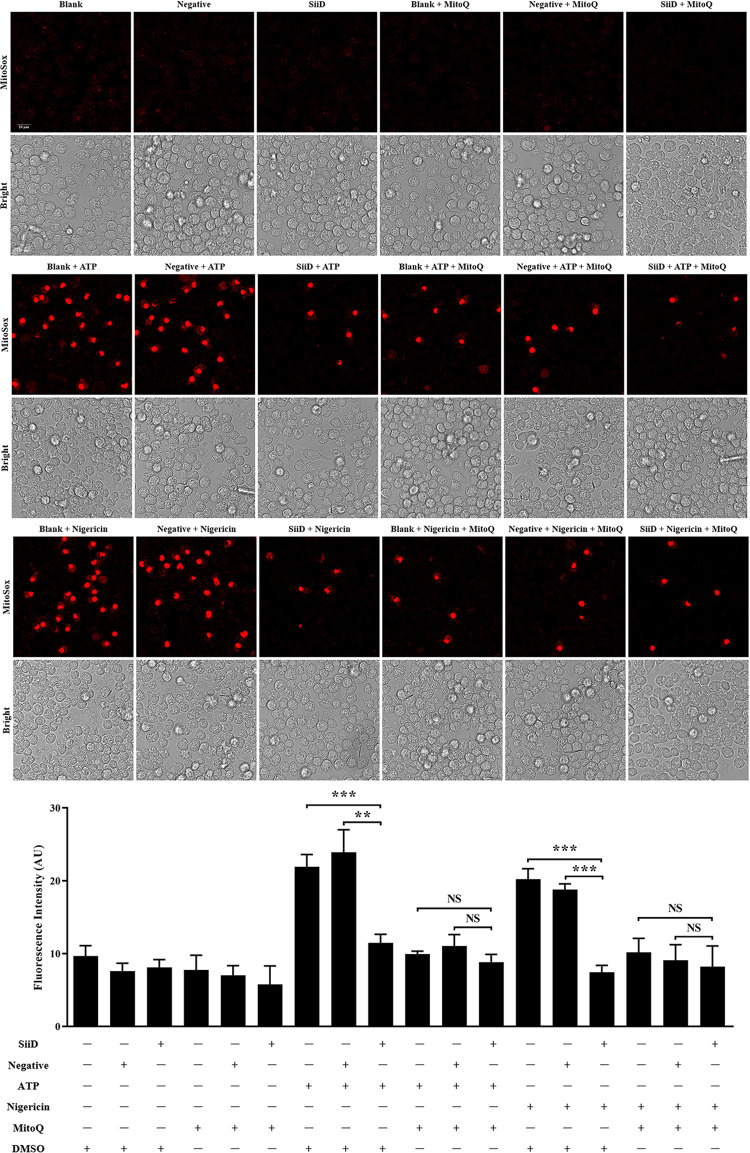
Fig 8. SiiD independently inhibited mtROS generation in macrophages.
J774A.1 cells were transduced with Lv-SiiD or Lv-NC lentivirus, untreated cells were used as a negative control (Blank). Cells were primed with LPS (1 μg/mL) for 5 h, MitoQ (10 nM) or vehicle control (DMSO) was added to cells 1 h after LPS treatment. Then cells were stimulated with or without ATP (1.25 mM) or nigericin (10 μM) for 1 h. (A) Cells were loaded with MitoSOX Red (5 μM) for 30 min after stimulation. Production of mitochondrial superoxide in infected cells were assayed. Scale bar, 20 μm. (B) The mean MitoSOX red fluorescence was quantified using Application Suite software. Data are presented as mean ± SEM of triplicate samples per experimental condition from three independent experiments. **p < 0.01, ***p < 0.001; NS, not significant, as measured by one-way ANOVA followed by Bonferroni’s multiple comparison test.

