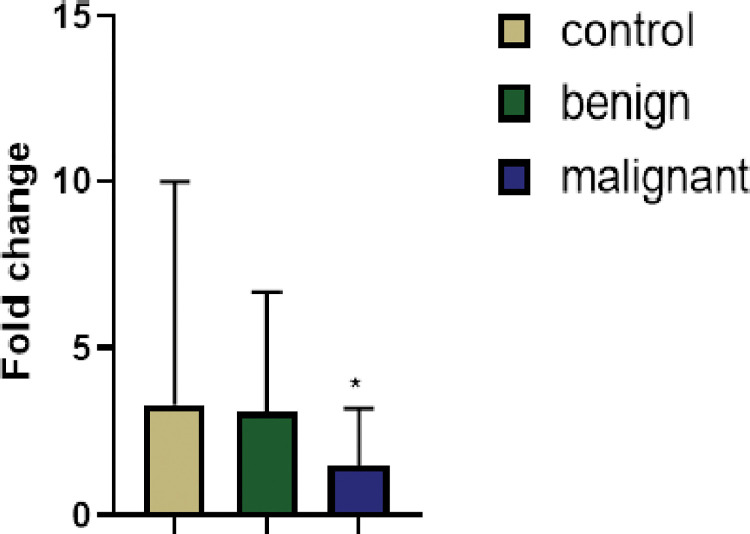
Fig 1. Fold change expression of the DDX43 gene relative to the reference gene (HPRT1), relative to the expression in the control samples.
Bar heights indicate the mean expression of the gene in several samples in the studied groups. Error bars show the standard deviation of the fold changes in each group. One asterisk indicates a statistically significant difference between the means of the malignant group compared to the mean of the benign group.

