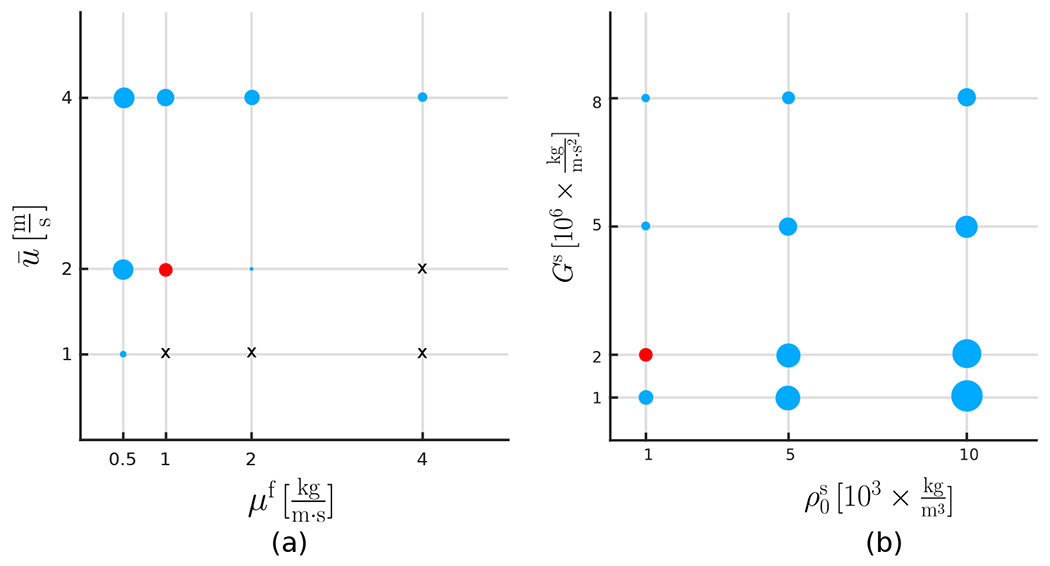
Figure 15:

(a) The vertical oscillation amplitude of point A at the flexible tail shown for a range of fluid viscosity and inlet mean velocity using case 2 of Table 1 as the default case with fixed values of and . The vertical amplitude sizes are depicted as blue circles of different diameters. The amplitude of given for case 2 of Table 2 is shown in color red as a reference size for comparison. (b) The vertical displacement of point A at the flexible tail shown for a range of solid density and shear modulus using case 2 of Table 1 as the default case with fixed values of and . As in panel (a), the amplitude of corresponding to case 2 of Table 2 (shown in color red) is used as a reference size for comparison. The ( pairs shown by “✕” correspond to cases for which no apparent oscillations are observed.
