
Figure 22:
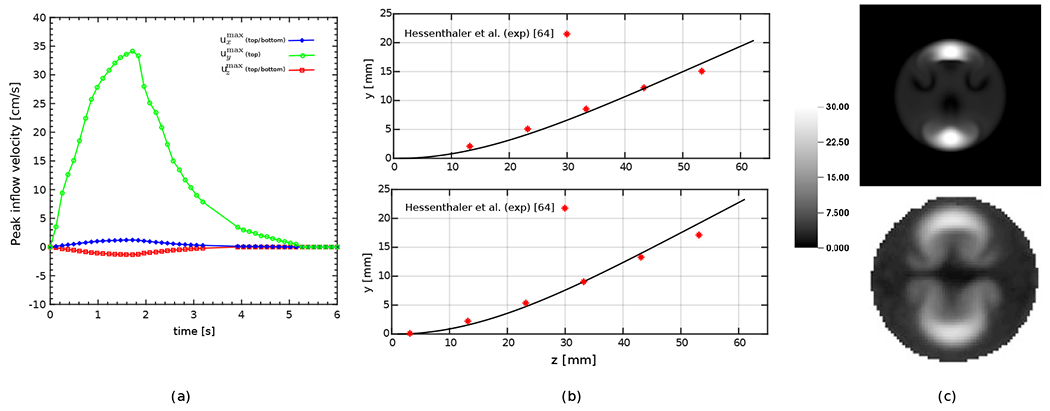
The Phase II benchmark of the flexible plate inside a flow phantom: (a) Measured peak inflow velocity of the parabolic profiles based on data from Hessenthaler et al. [64] used as boundary conditions of the top inlet. The bottom inlet uses the same velocity profile as the top inlet except using for the -component. (b) Sample results of the deformation of the flexible plate including the centerline’s -position at (top) and (bottom). Red stars show measured data by Hessenthaler et al. [64]. (c) velocity component magnitudes at at the time for the present simulation (top) and the MRI measurements [64] (bottom).