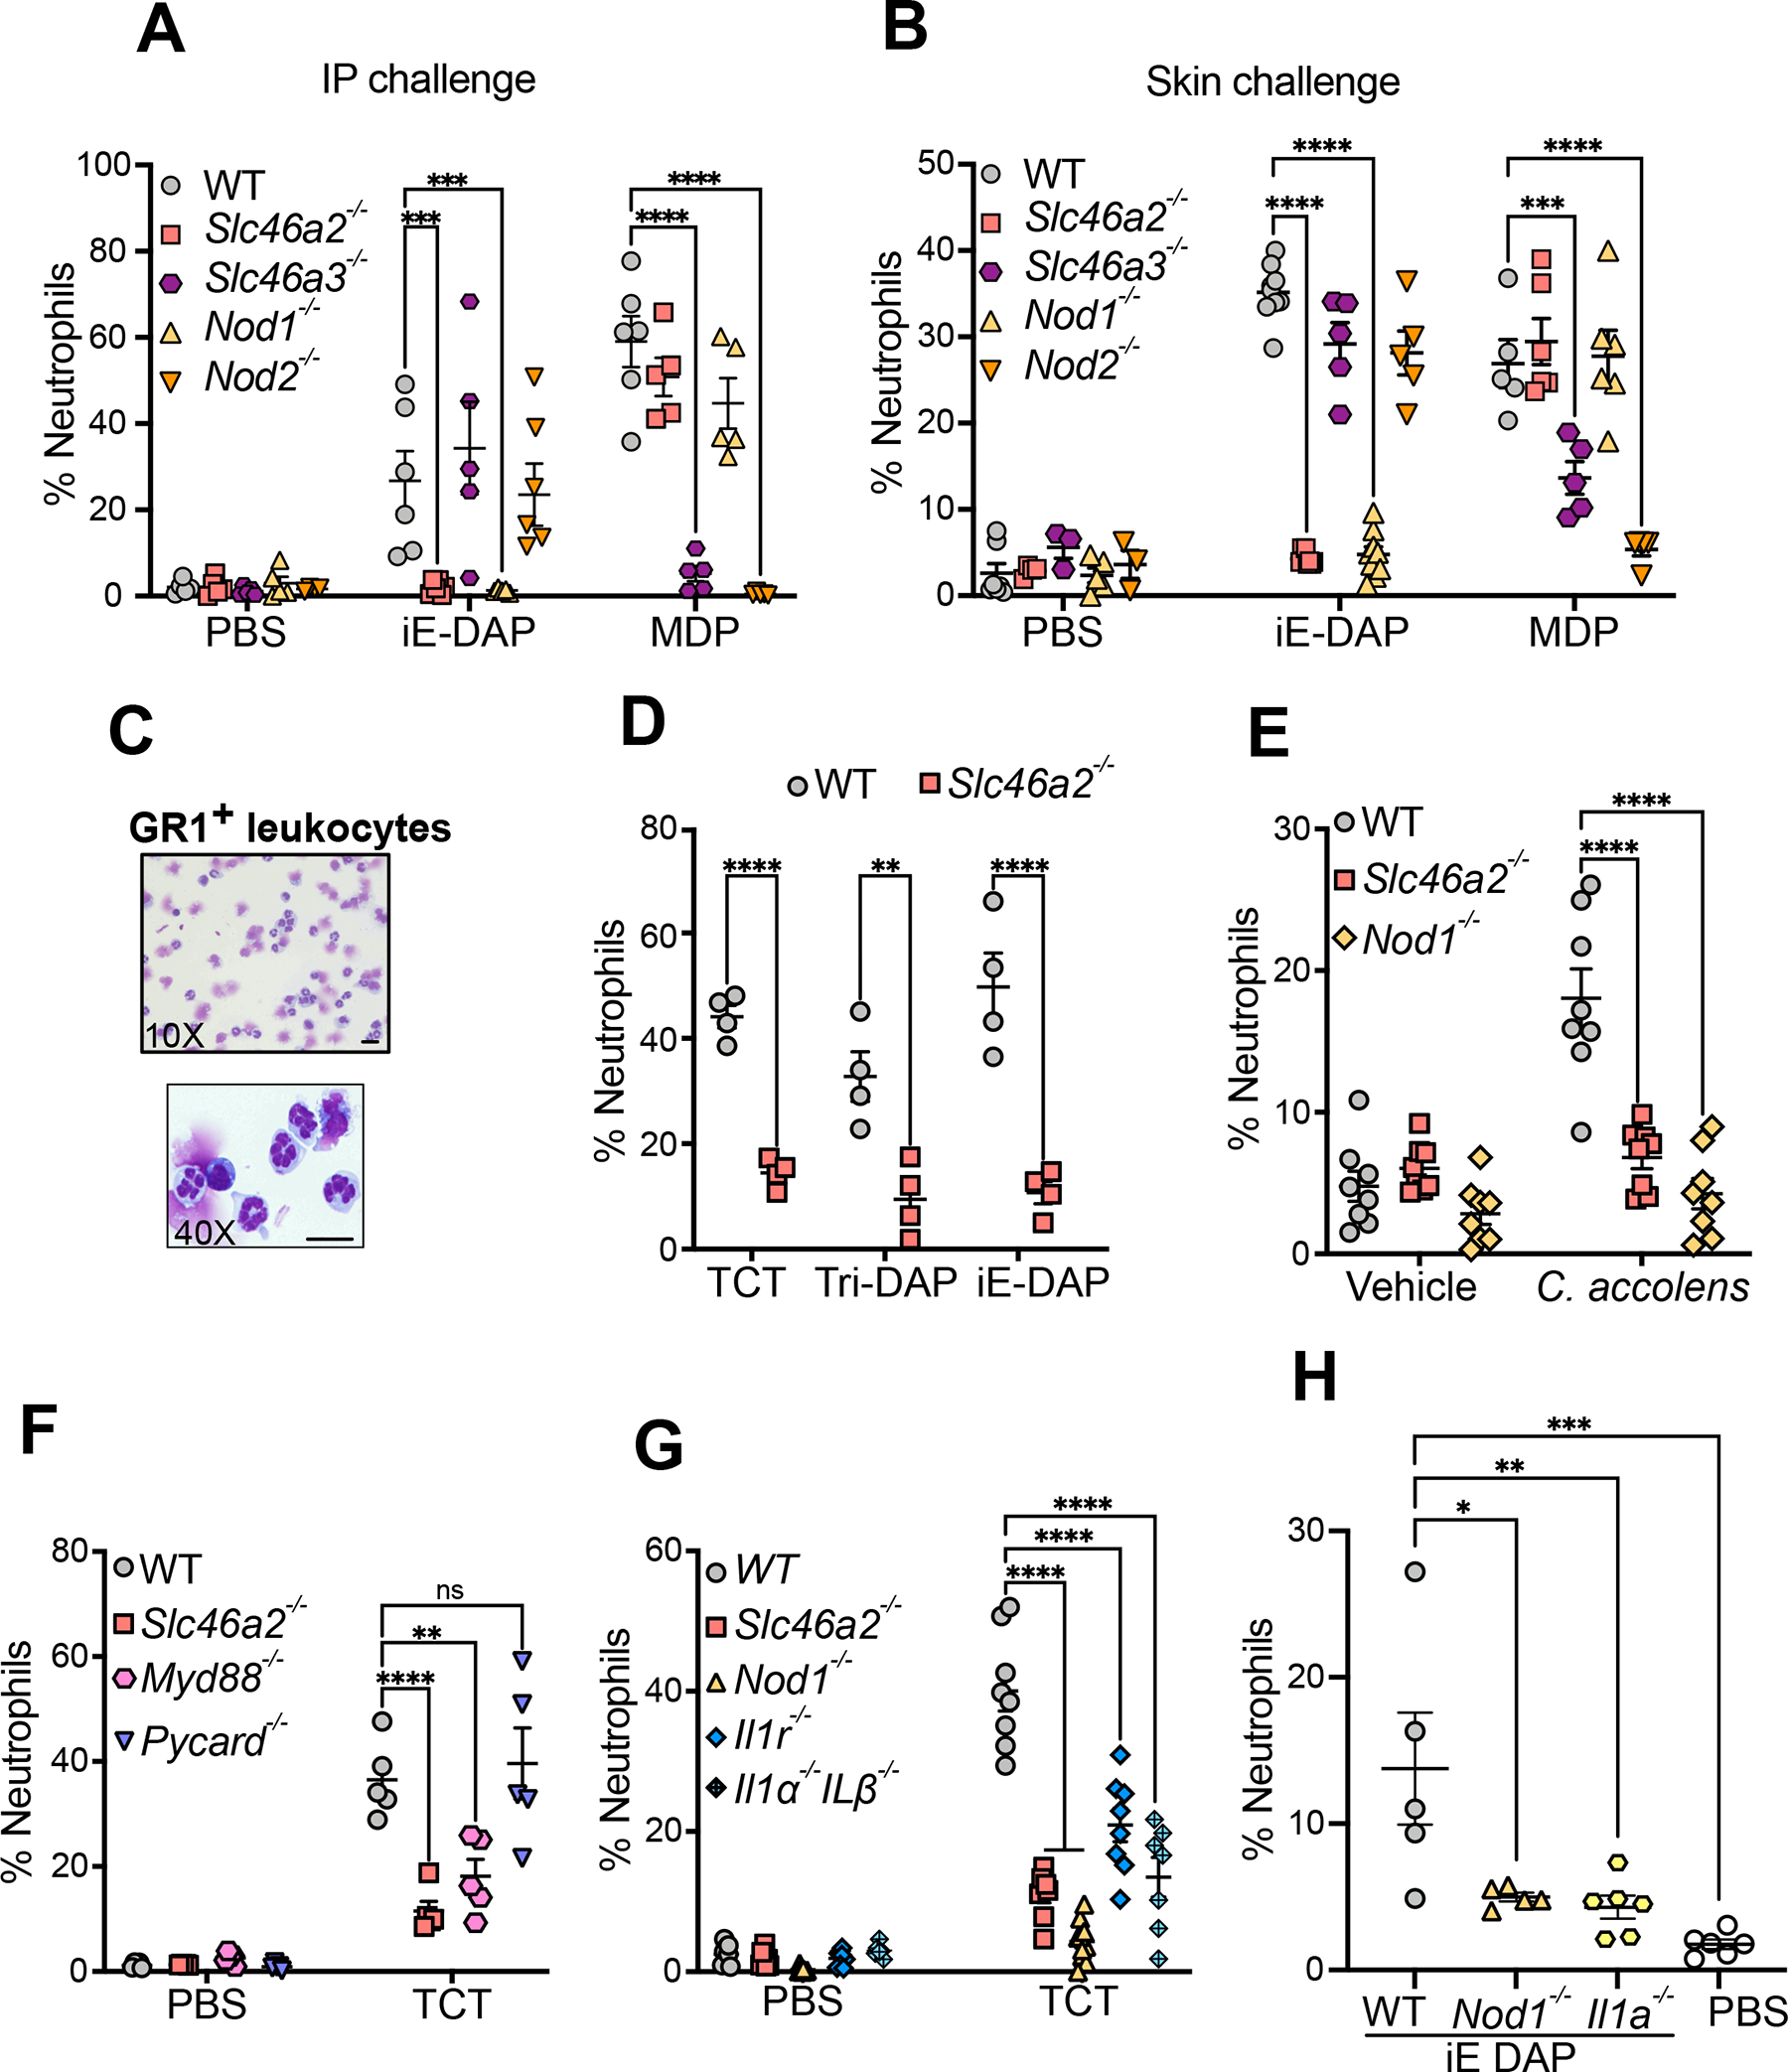
Fig. 1. Slc46a2 is required for neutrophil recruitment in response to NOD1 stimulation in the mouse peritoneum and skin.

(A) Neutrophil recruitment in the peritoneum 3 h after intraperitoneal injection of 100 μl iE-DAP (30 μM) or MDP (10 μM), shown as a percent of CD45+ cells, in wild type, Slc46a2−/−, Nod1−/−, Slc46a3−/− or Nod2−/− mice. See also Figure S1A–F.
(B) Neutrophil recruitment to the skin 3 h after intradermal injection of 10 μl iE-DAP (30 μM) or MDP (10 μM), shown as a percent of CD45+ cells, in wild type, Slc46a2−/−, Nod1−/−, Slc46a3−/− or Nod2−/− mice. See also Figure S1G–H.
(C) Images of FACS sorted GR1+ neutrophils 3 h after iE-DAP challenge from WT mouse skin. Cells prepared using cytospin and stained with Giemsa stain show multilobed nuclei.
(D) Neutrophil recruitment to the skin shown as a percent of CD45+ cells, 3 h after intradermal challenged with 10 μl different DAP-type muropeptides, TCT (8 μM), iE-DAP (30 μM), or Tri-DAP (25 μM), comparing wild type and Slc46a2−/− animals.
(E) Neutrophil recruitment measured 3 h after topical association of tape-stripped pinnae skin with C. accolens, shown as a percent of CD45+ cells, in wild type, Slc46a2−/−, or Nod1−/− animals. See also Figure S2A.
(F) Recruitment of neutrophils to pinnae 3 h after intradermal injection of 10 μl of 8 μM TCT or PBS in WT, Slc46a2−/−, Myd88−/− or Pycard−/− (Asc-deficient) mice, shown as a percent of CD45+ cells.
(G) Recruitment of neutrophils to pinnae 3 h after intradermal injection of 10 μl of 8 μM TCT or PBS in WT, Slc46a2−/−, Il1r1−/−, or Il1a−/− & Il1b−/−, shown as a percent of CD45+ cells. See also Figure S2B and S2C.
(H) Recruitment of neutrophils after 3 h of intradermal injection of 10 μl of 30 μM iE-DAP in WT, Il1a−/−, or Nod1−/− mice, shown as a percent of CD45+ cells. See also Figure S2D.
Genotypes are indicated on all panels. Comparisons with two-way ANOVA with Tukey’s multiple comparisons test to determine significance. **** P < 0.0001; *** P < 0.001; ** P < 0.01; * P < 0.05; ns, not significant. Each dot represents an individual animal, data pooled from two to four separate trials, except for panel C which shows a representative image from three independent experiments. The scale bar is 10μM. See also Figures S1 & S2
