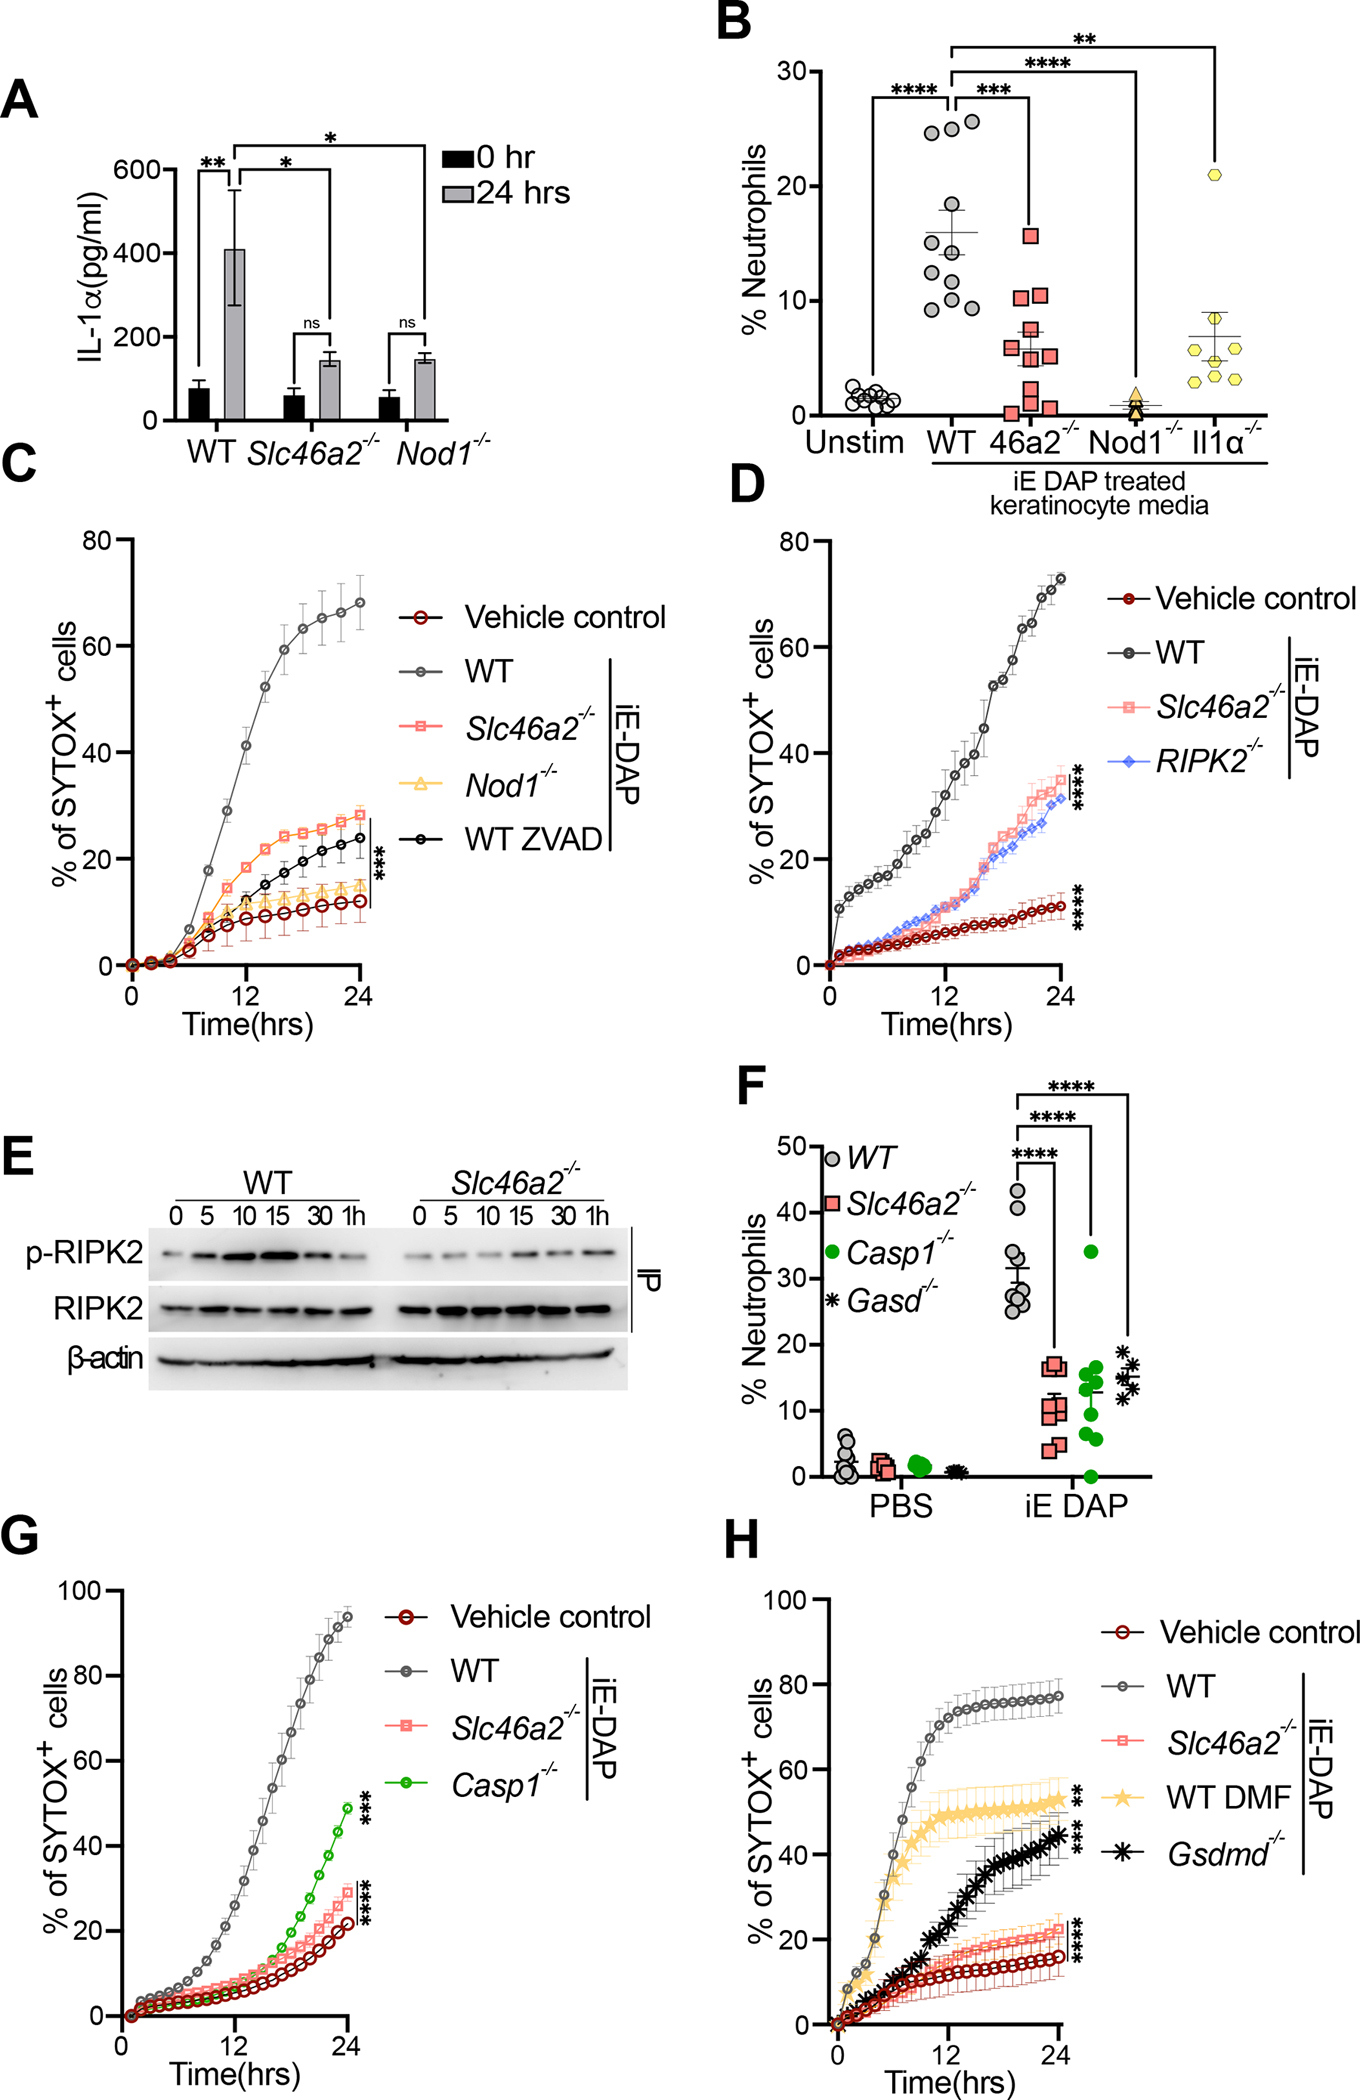
Fig. 2. Primary mouse epidermal keratinocytes respond to DAP-muropeptides via Slc46a2 and Nod1.

(A) Primary keratinocytes from wild type, Slc46a2−/−, or Nod1−/− mice were isolated and cultured ex vivo, stimulated with 30 μM iE DAP for 24 h, and supernatants were assayed for IL-1α cytokine production by ELISA. See also Figure S2E–F and S2I, where other cytokines were similarly analyzed.
(B) Neutrophil recruitment to the peritoneum of naïve wild type mice after IP injection of conditioned media from WT, Slc46a2−/−, Nod1−/− or Il1a−/− keratinocytes stimulated with 30 μM iE-DAP for 24 h, or unstimulated as a control, shown as a percent of CD45+ cells. See also Figure S2G and S2H.
(C) Using live cell imaging, WT, Slc46a2−/− and Nod1−/− keratinocyte permeabilization was measured with a Sytox dye uptake assay over a 24 h time course following 30 μM iE-DAP treatment. Additionally, WT keratinocytes were pre-treated with pan-caspase inhibitor zVAD-fmk (10μm). An equal volume of DMSO was added to the media as vehicle control.
(D) Similar to (C) using live cell imaging, WT, Slc46a2−/− and Ripk2−/− keratinocyte permeabilization was measured with a Sytox dye uptake assay over a 24 h time course following 30 μM iE-DAP treatment. Vehicle control was media alone.
(E) Immunoprecipitation-immunoblot of lysates from iE-DAP challenged keratinocytes probed for phospho- RIPK2, total RIPK2, and β-actin from whole cell lysates.
(F) Neutrophil recruitment to pinnae 3 h after intradermal injection of 10μl of 30 μM iE-DAP in WT, Slc46a2−/−, Casp1−/− and Gasdmd−/−, shown as a percent of CD45+ cells.
(G) Similar to (C), Sytox uptake was measured in WT, Slc46a2−/−, Nod1−/−, or Casp1−/− keratinocytes for 24 hours after challenge with 30 μM iE-DAP. Vehicle control was media alone.
(H) Sytox dye uptake by keratinocytes over 24h following 30 μM iE-DAP challenge in WT, Slc46a2−/−, and Gasdmd−/−. WT keratinocytes were also treated with the Gasdermin inhibitor DMF (50 μM). An equal volume of DMSO was added to the media as vehicle control.
Genotypes are indicated on all panels. Panels A displays data from 3 independent measurements and is representative of at least 3 separate trials, error bars represent standard error of the mean (SEM) and analyzed by two-way ANOVA and Tukey’s multiple comparisons tests. For panels B & F each dot represents an individual mouse, data pooled from 2 separate trials, analyzed by two-way ANOVA and Tukey’s multiple comparisons tests. In panels C, D, G, & H each data point represents the mean with SEM of at least three independent measurements, and are representative of 2 to 4 separate trials, analyzed by one-way ANOVA and Tukey’s multiple comparisons tests. Panel E shows a representative image from three independent experiments. **** P < 0.0001; *** P < 0.001; ** P < 0.01; * P < 0.05; ns, not significant. See also Figures S2.
