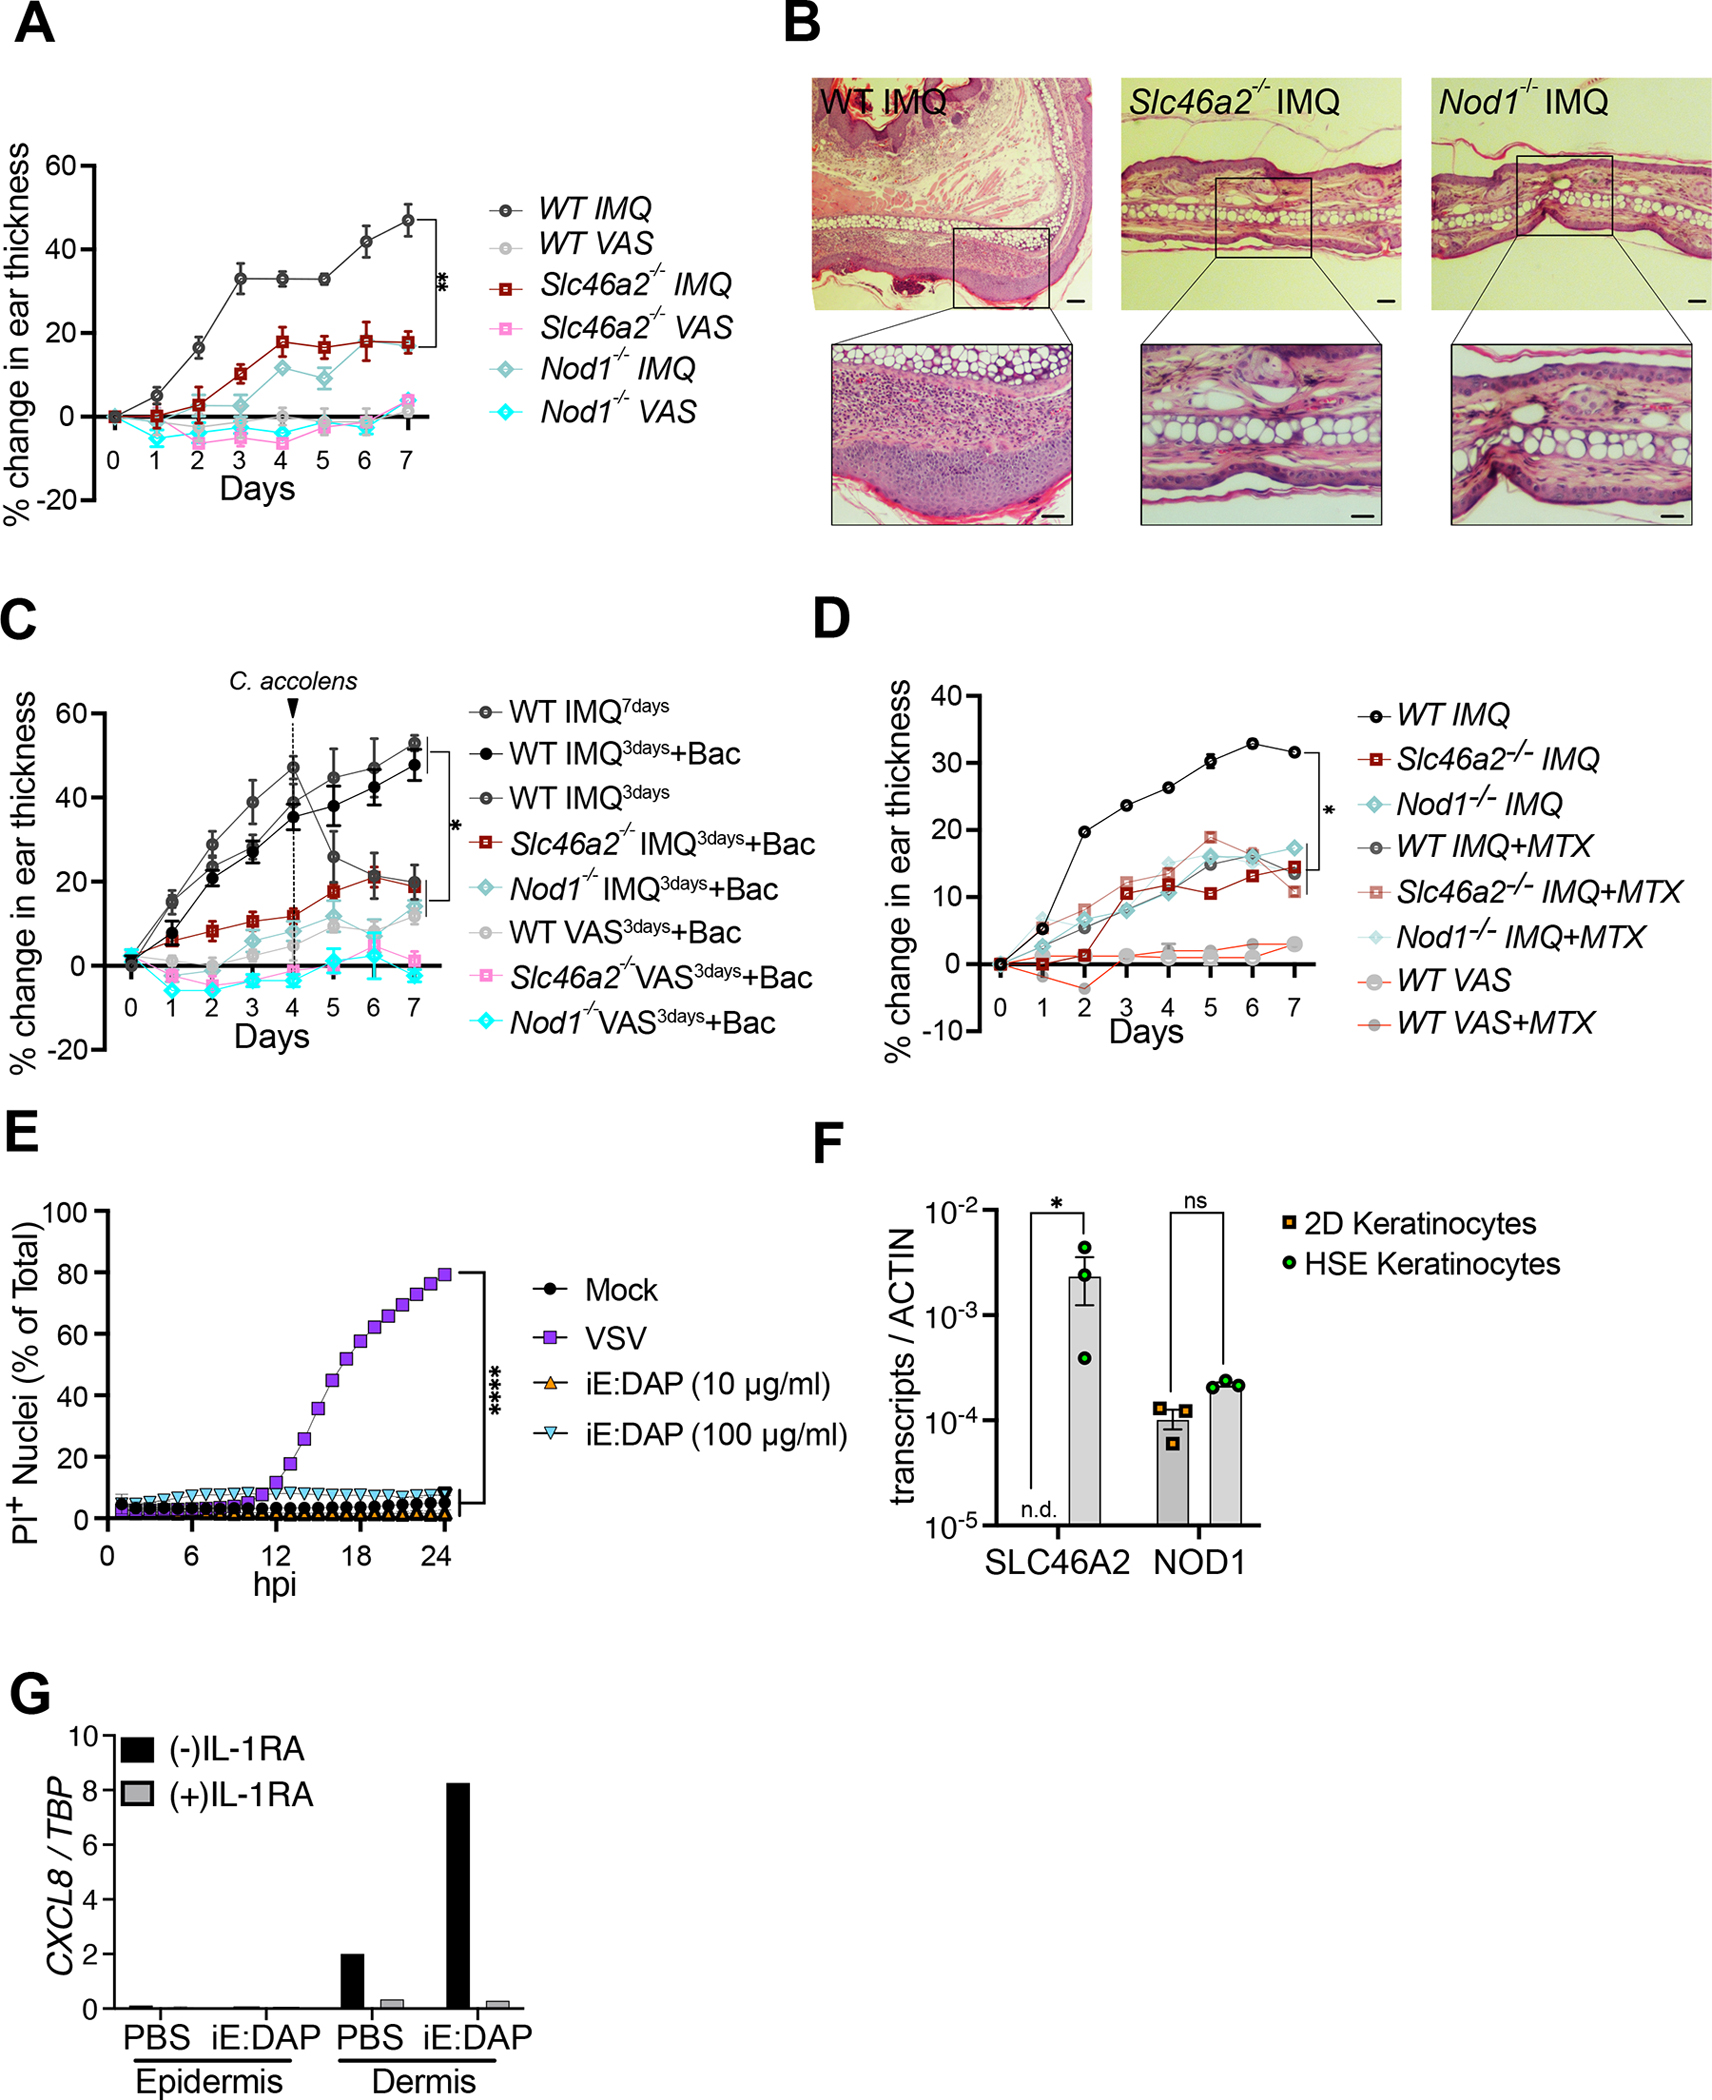
Fig. 5. Slc46a2−/− and Nod1−/− mice are resistant to IMQ-induced psoriatic inflammation.

(A) 5% imiquimod (IMQ) was topically applied with daily for 7 days to pinnae to induce psoriasis and ear inflammation was quantified daily by caliper measurement. Contralateral pinnae were treated with Vaseline (VAS) as vehicle control. The mean thickness of the pinnae and SEM are plotted.
(B) H&E-stained histology images of IMQ-treated pinnae on day 7 from the experiment in (A). Genotypes are indicated on all panels. Vaseline control treated pinnae shown in Figure S5A.
(C) IMQ was applied for only 3 days, and then pinnae were treated daily for 3 days with topical application of live C. accolens (107 CFU/ml), except for controls with either a full 7 days or just 3 days of IMQ treatment. Contralateral pinnae were treated with VAS as vehicle control or VAS with C. accolens. The mean thickness and SEM of the pinnae is plotted. See also Figure S5B–S5D.
(D) is similar to (A) except IMQ was applied daily along with 50 μl of 250 μM MTX. The mean thickness and SEM of the pinnae is plotted. See also Figure S5E and S5F.
(E) Propidium Iodide (PI) uptake assay using primary human foreskin keratinocytes challenged with indicated iE-DAP doses or VSV infection (MOI 10) as a positive control. iE-DAP treatment did not induce cell permeabilization in human keratinocytes.
(F) Expression analysis of SLC46A2 and NOD1 in human keratinocytes grown in 2D culture and 3D skin organoids (HSE).
(G) Induction of CXCL8 in skin organoid epidermal and dermal layers after PBS or iE-DAP challenge of the epidermis in the presence and absence of IL-1 receptor inhibitor (IL-1RA). High expression of CXCL8 was observed in the dermis following the iE-DAP challenge of the epidermis, and this was blocked by IL-1RA. See also Figure S5G and S5H.
In panels A, C, D, and E each data point displays the mean and SEM from 5 animals in each group, data representative of 2 to 4 separate trials. Significance was analyzed by one-way ANOVA with Tukey’s multiple comparisons tests. Panels B and G are representatives of three independent experimental results. For panel F, each dot represents an independent experiment result, with bar displaying mean and SEM indicated, analyzed by a two-way ANOVA and Tukey’s multiple comparisons tests. **** P < 0.0001; *** P < 0.001; ** P < 0.01; * P < 0.05; ns, not significant. The scale bar is 100μM. See also Figure S5.
