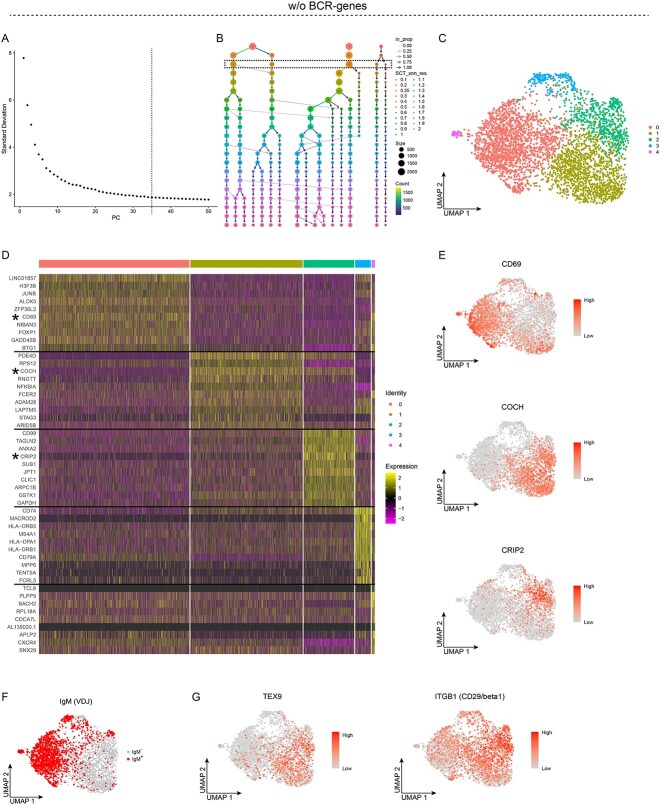
Figure 1.
Unsupervised clustering of peripheral blood memory B cells after removal of the BCR-genes, with results for five clusters. A-G, Analyses of single-cell RNA sequencing data from sorted PB memory B cells after the BCR-genes were removed. A, Elbow plot showing the standard deviation explained by each PC; the dashed line depicts the number of PCs used for the unsupervised clustering. B, Clustree plot showing the size and the number of clusters for different values of the Seurat::FindClusters resolution parameter. C, UMAP projection and unsupervised clustering of PB memory B cells. D, Heat map displaying the scaled relative expression of the top-10 significantly up-regulated genes for each cluster (Bonferroni-adjusted P-values <0.05 of the Seurat negative binomial generalized linear model). Gene list in Table S1. Asterisks indicate genes plotted in E, and the black horizontal lines indicate which DEGs are found in each cluster. E-G, UMAP projection of all the cells: E, colour scheme according to the scaled level of gene expression; F, cells expressing a productively re-arranged IgM are highlighted; and G, colour scheme according to the scaled level of gene expression.

