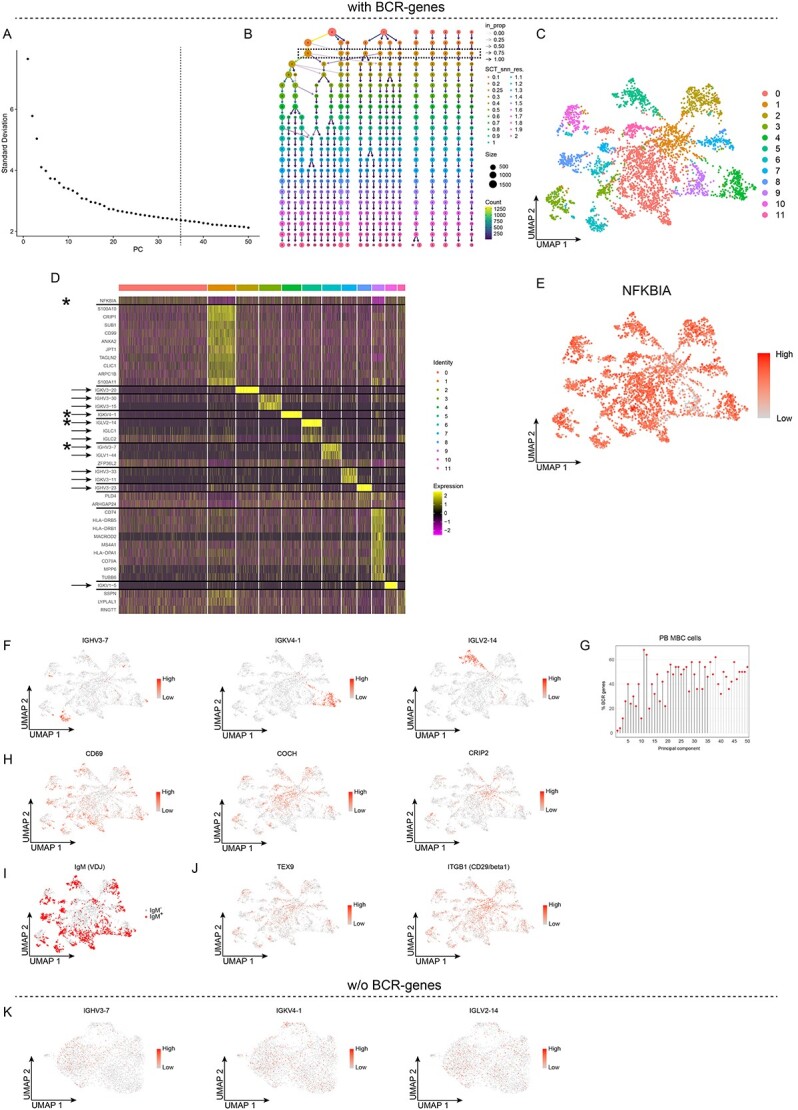
Figure 2.

Unsupervised clustering of peripheral blood memory B cells retaining the BCR-genes, with results for 12 clusters. A-J, Analyses of single-cell RNA sequencing data for sorted PB memory B cells with the BCR-genes retained. A, Elbow plot showing the standard deviation explained by each PC; the dashed line depicts the number of PCs used for the unsupervised clustering. B, Clustree plot showing the size and the number of clusters for different values of the Seurat::FindClusters resolution parameter. C, UMAP projection and unsupervised clustering of PB memory B cells. D, Heat map displaying the scaled relative expression of the top-10 significantly up-regulated genes for each cluster (Bonferroni-adjusted P-values <0.05 of the Seurat negative binomial generalized linear model). Gene list in Table S1. The asterisks indicate genes plotted in E and F, the black horizontal lines indicate which DEGs are found in each cluster, and the arrows indicate the BCR-genes. E, F, H and J, UMAP projection of all the cells, coloured according to the scaled level of gene expression. G, Lollipop plot displaying the percentages of BCR-genes among the top-50 genes in the first 50 PCs; PCs used for unsupervised clustering are indicated by black stems. I, UMAP projection of all cells, with cells expressing a productively re-arranged IgM highlighted in red. K, UMAP projection of PB memory B cells clustered without BCR-genes, whereby the BCR-genes were then added back, and their scaled levels of gene expression are shown.
