Figure 3.

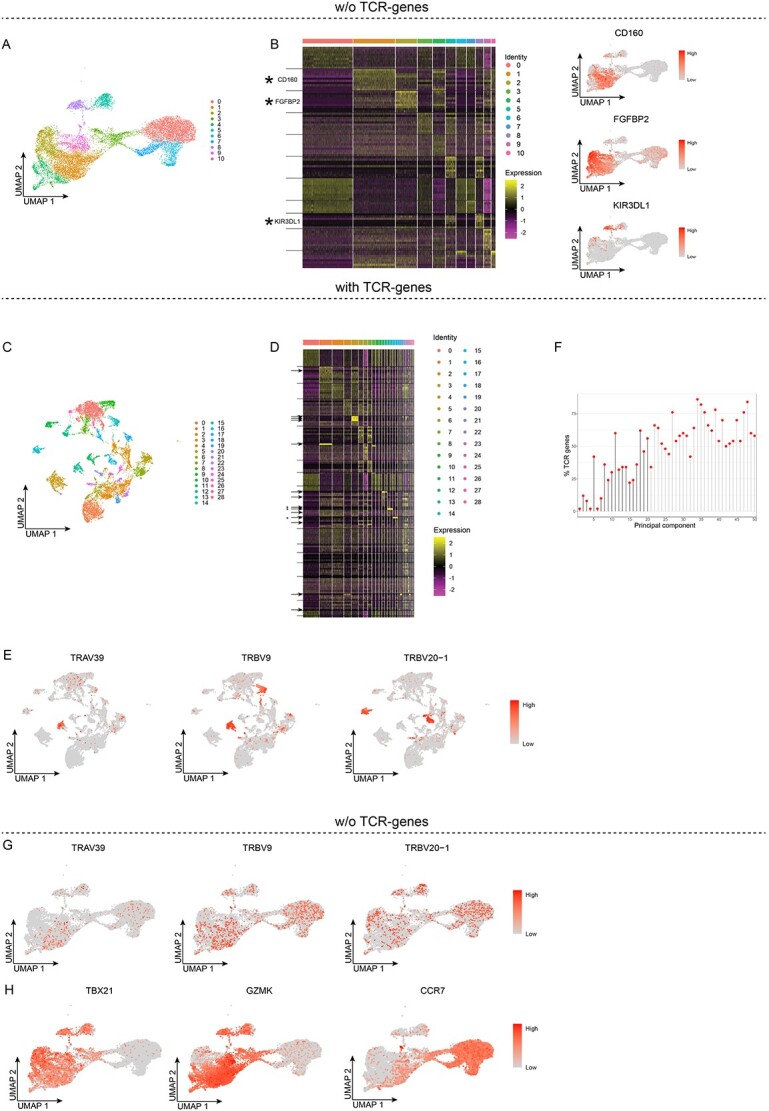
TCR-genes influence unsupervised clustering of peripheral blood CD8+ T cells. A and B, Unsupervised clustering without TCR-genes. A, UMAP projection and unsupervised clustering of PB CD8+ T cells. B, Heat map displaying the scaled relative expression levels of the top-10 significantly up-regulated genes in each cluster (Bonferroni-adjusted P-values <0.05 of the Seurat negative binomial generalized linear model). The black horizontal lines indicate which DEGs are found in each cluster. Gene list in Table S2. C-F, Unsupervised clustering with the TCR-genes retained. C, UMAP projection and unsupervised clustering. D, Heat map displaying the scaled relative expression levels of the top-10 significantly up-regulated genes in each cluster (Bonferroni-adjusted P-values <0.05 of the Seurat negative binomial generalized linear model). The asterisks indicate genes plotted in E, the arrows indicate the TCR-genes, and the black horizontal lines indicate which DEGs are found in each cluster. Gene list in Table S2. E, UMAP projection of all cells, coloured according to the scaled gene expression level. F, Lollipop plot displaying the percentages of TCR-genes among the top-50 genes in the first 50 PCs; PCs used for unsupervised clustering are indicated by black stems. G and H, UMAP projection of PB CD8+ T cells clustered without TCR-genes, whereby the TCR-genes were added back, and their scaled gene expression is shown.
