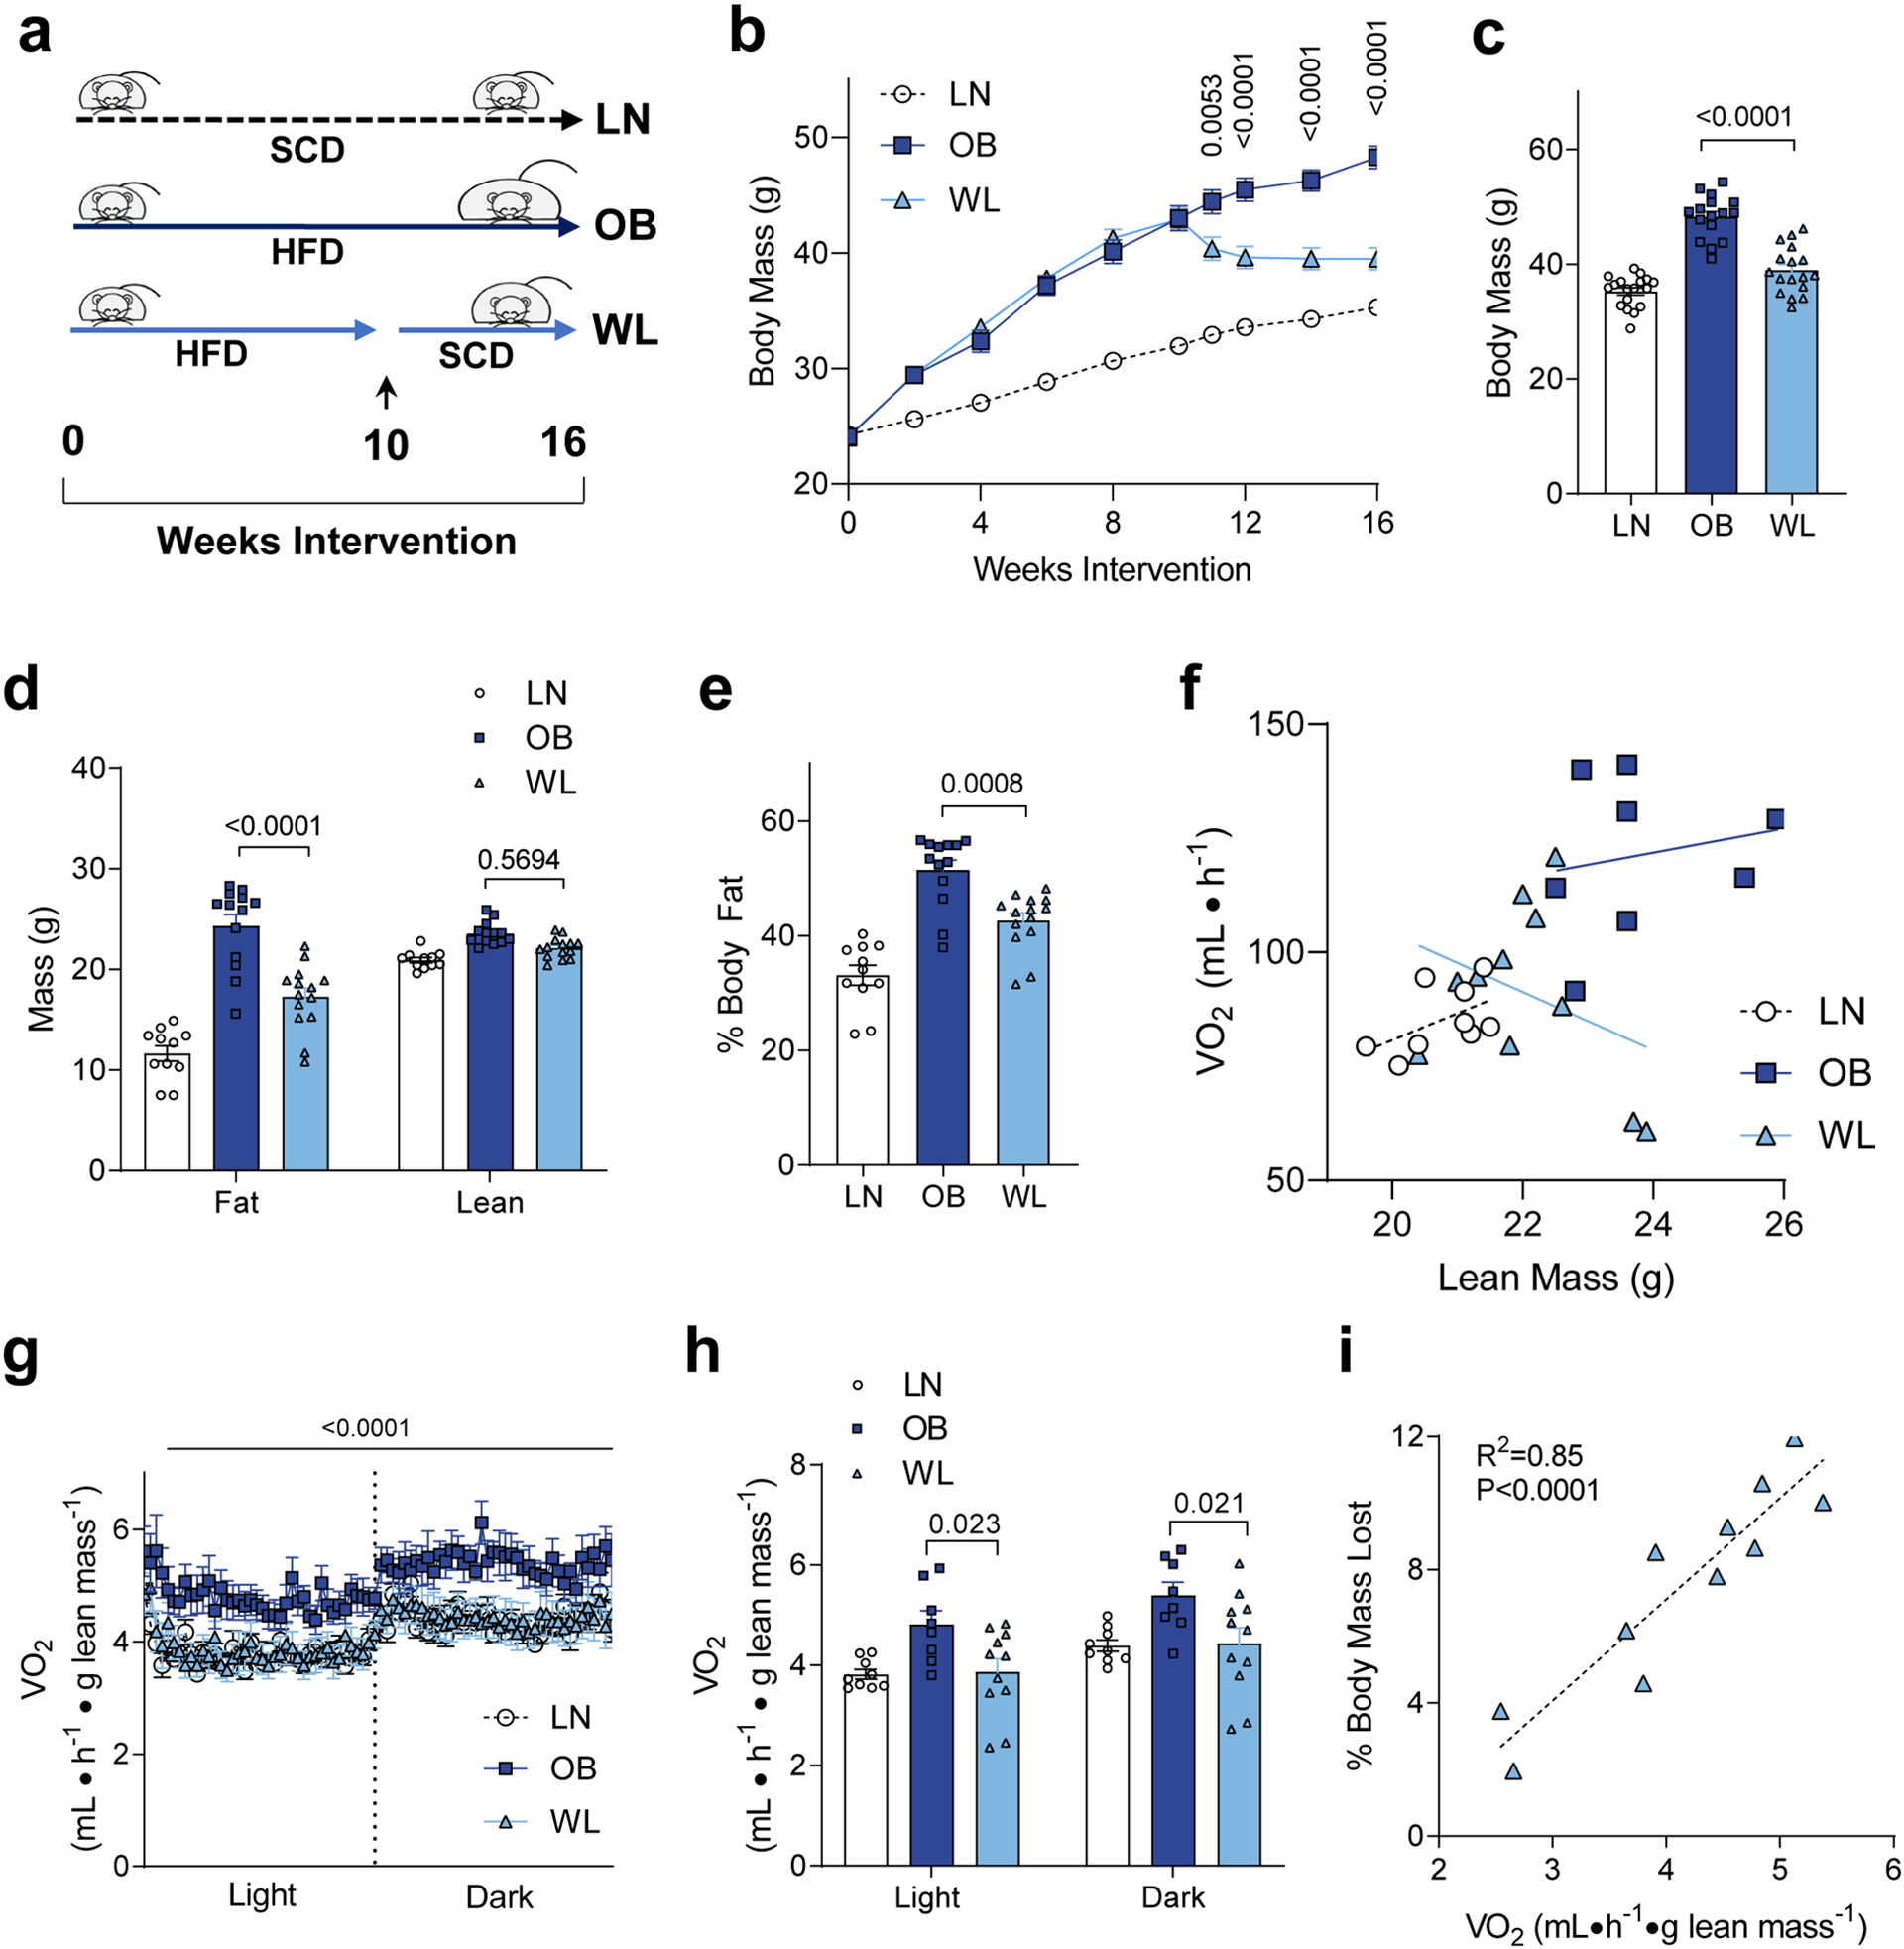
Figure 1. Weight loss promotes a decrease in whole-body energy expenditure.

(a) Feeding timeline. LN: mice fed standard chow diet (SCD). OB: mice fed obesogenic high-fat diet (HFD). WL: mice with weight loss induced by switching from HFD to SCD at week 10. Ad lib fed for all mice. (b) Body mass of LN, OB and WL mice over the 16-week diet intervention. (c) Body mass just before terminal experiments. n =18 for LN, n =16 for OB, n =19 for WL for b and c. (d and e) Body composition measured just before terminal experiments. n =11 for LN, n =13 for OB, n =14 for WL for both d and e. (f) Relationship between lean mass and total VO2 (unnormalized) in LN, OB, and WL groups (n =9 for LN, n =8 for OB, n =11 for WL). (g and h) Whole-body oxygen consumption normalized to lean mass (n =9 for LN, n =8 for OB, n =11 for WL) at week 15. (i) Pearson correlation analyses of percent body weight loss to the oxygen consumption among the WL group (n =11). All data are represented as mean ± SEM. Two-way ANOVA with Sidak multiple comparisons (b, d, g, h) or one-way ANOVA with multiple comparisons (c, e). P-values indicate statistical significance between OB and WL groups.
