
Figure 3. Weight loss does not alter skeletal muscle mitochondrial proteome.
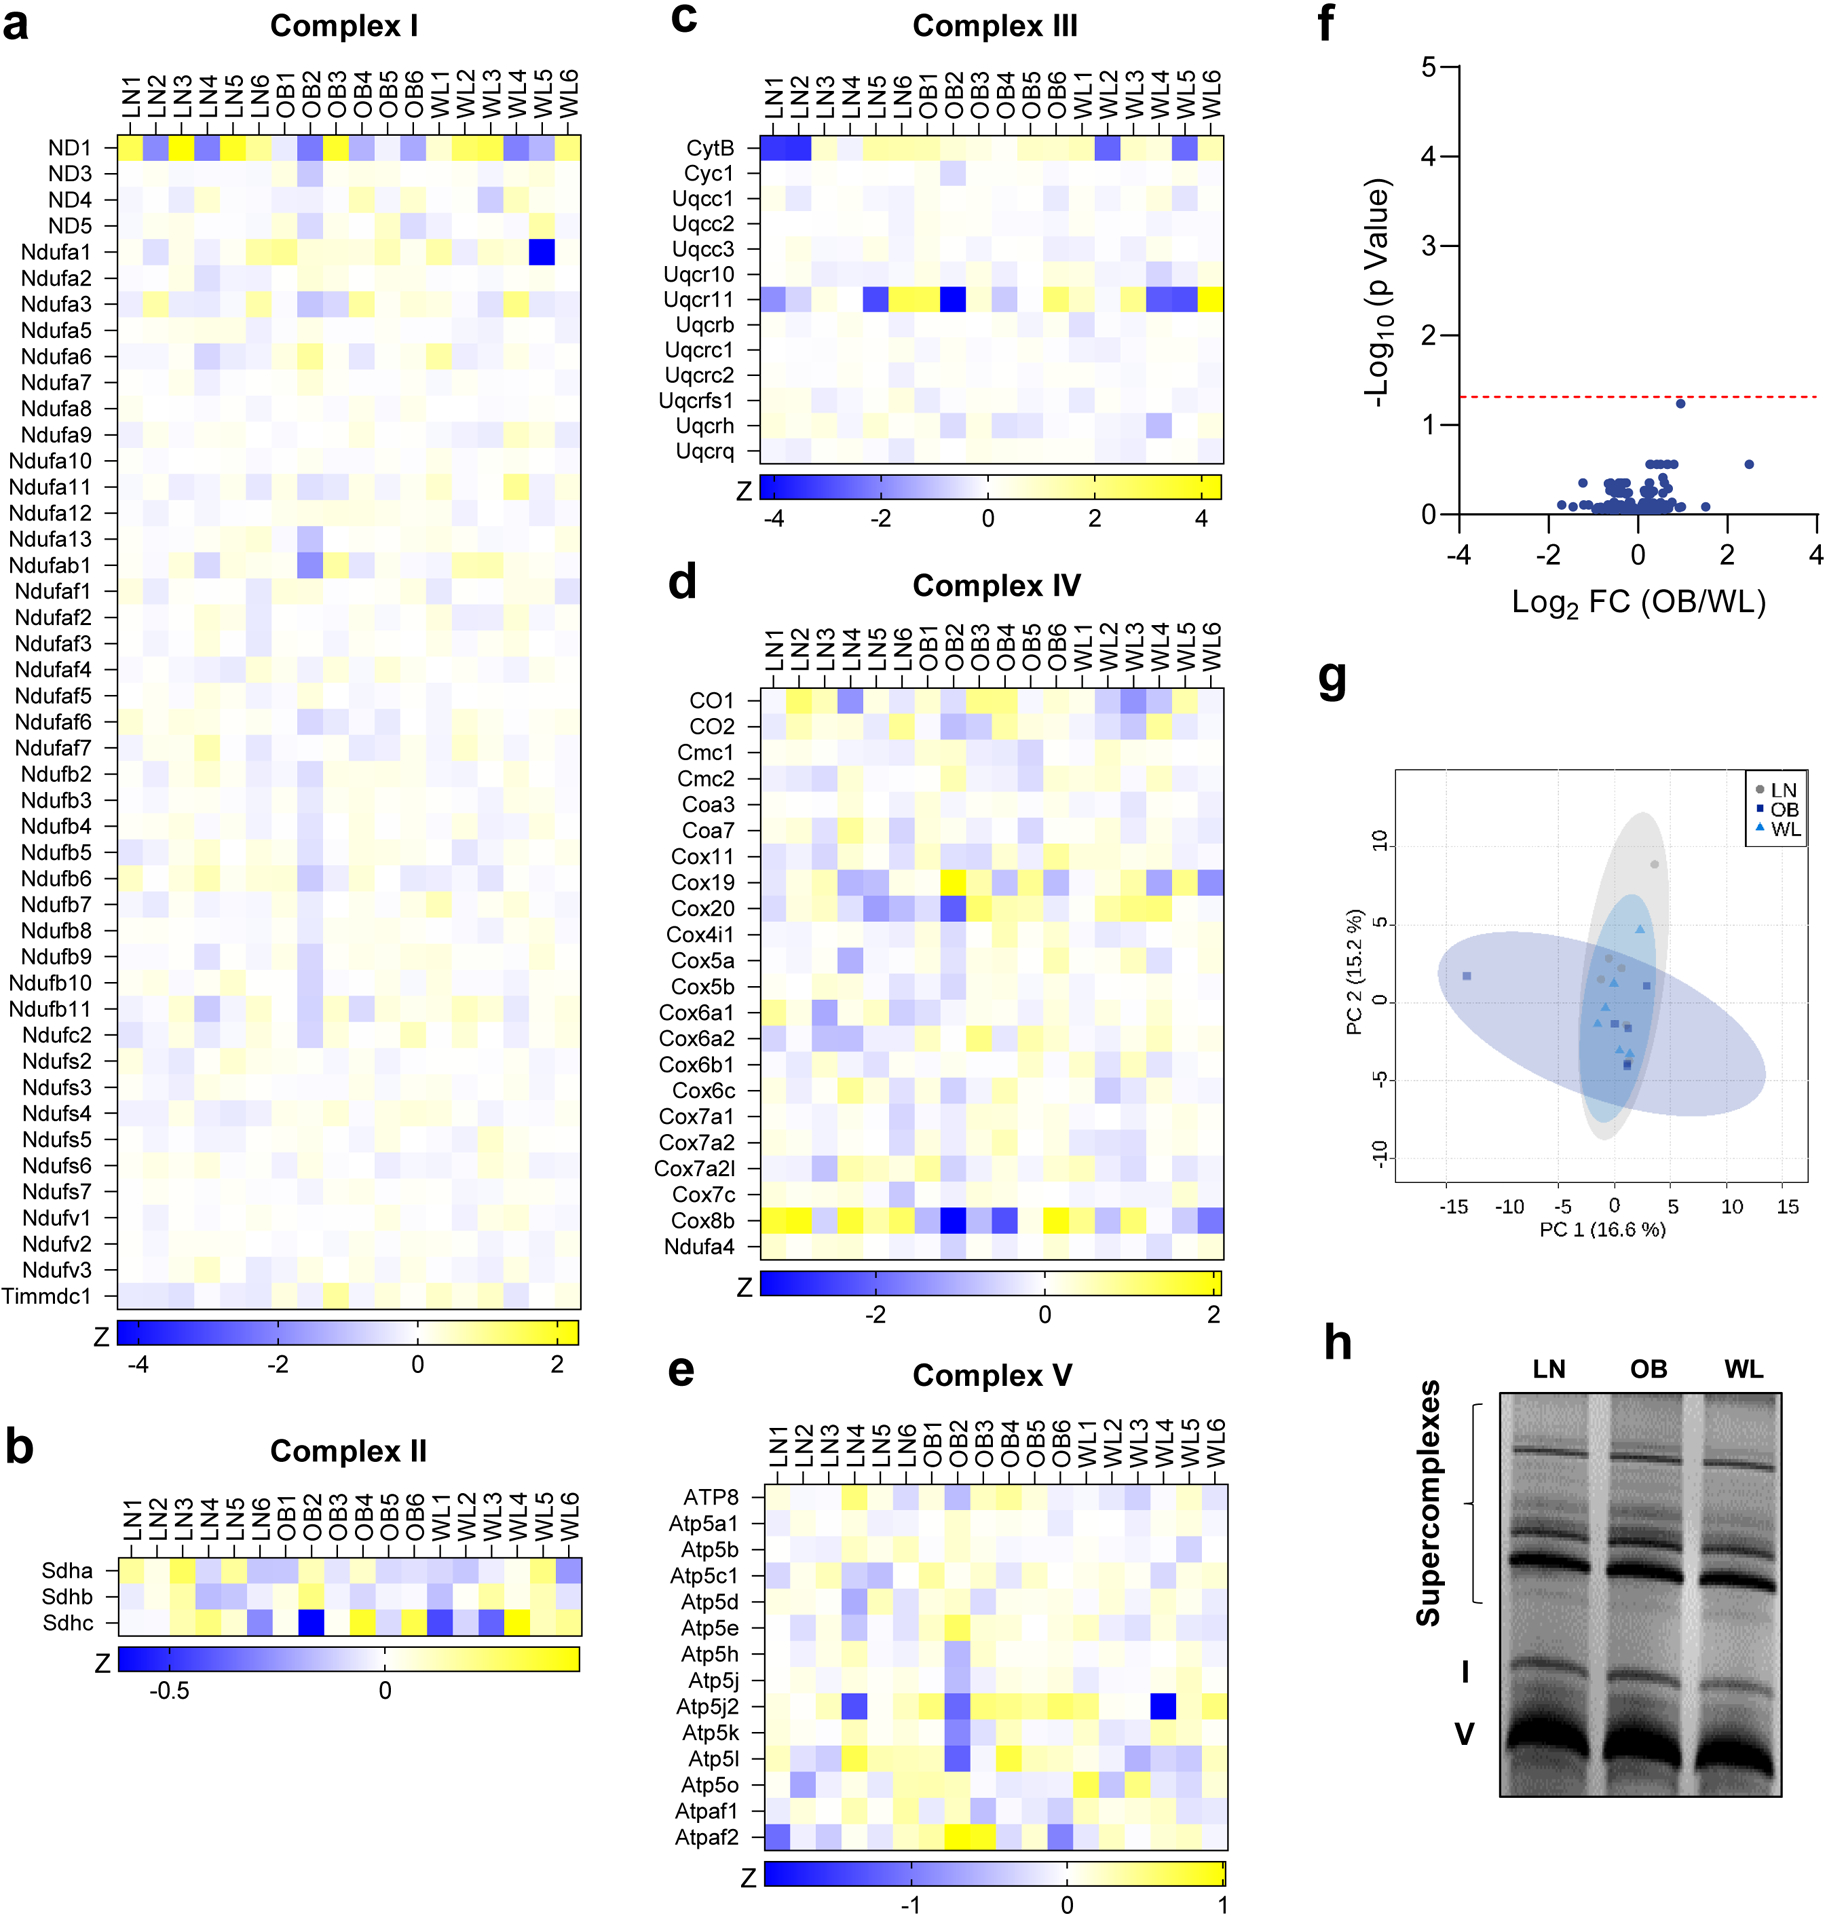
(a−e) Heatmap of abundance of OXPHOS subunits measured with mass spectrometry. (f) Volcano plot of differentially abundant mitochondria proteins between OB and WL groups (significance threshold shown with dotted red line). (g) Principal component analysis of mitochondrial proteomic data. (h) Abundance of respiratory supercomplex formation in isolated mitochondria.