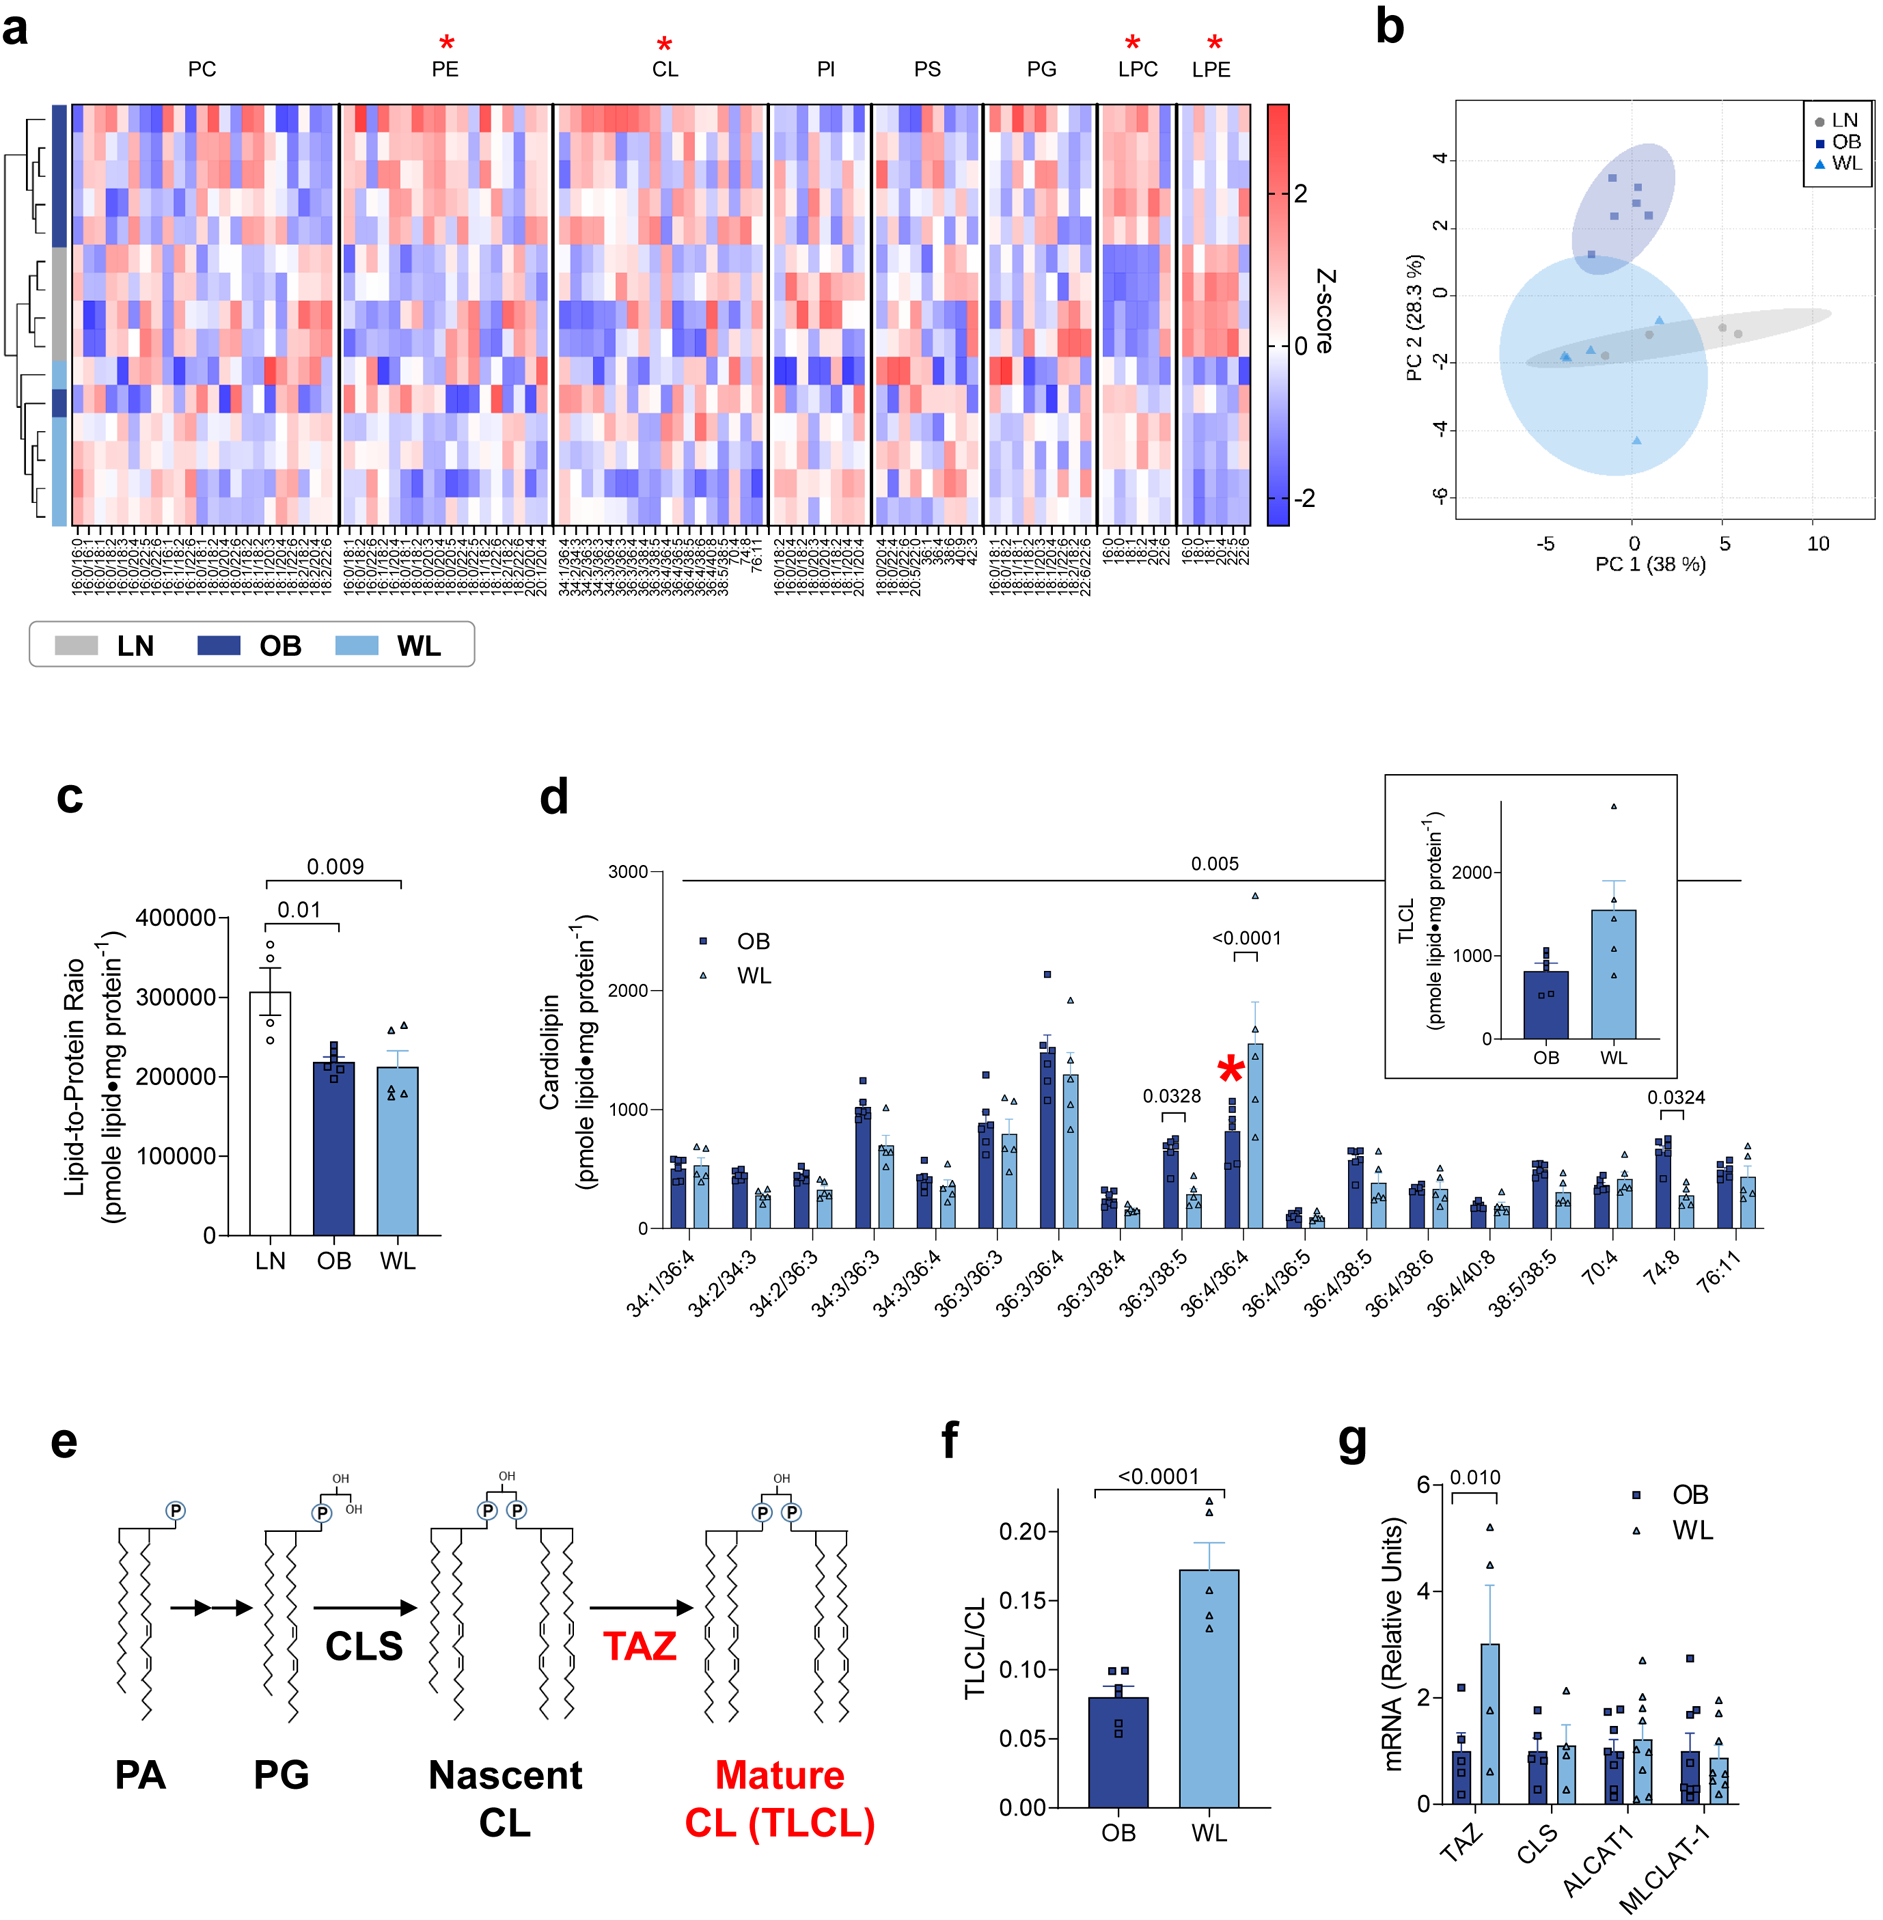
Figure 4. Weight loss accelerates skeletal muscle CL remodeling.

(a) Heatmap of relative abundance of mitochondrial lipids. X-axis represents individual lipid species classified according to lipid classes. Hierarchical clustering is shown on the left. Red asterisks indicate the main effect of weight loss (OB vs. WL). (b) Principal component analysis shows divergence in the mitochondrial lipidome. (c) Lipid-to-protein ratio. n =4 for LN, n =6 for OB, n =5 for WL for a−c. (d) Abundance of individual CL species in isolated mitochondria. TLCL is shown in red asterisk and separately as an insert (n =6 for OB, n =5 for WL). (e) Schematic of CL synthesis and remodeling that occurs in the inner mitochondrial membrane. (f) TLCL to total CL ratio (n =6 for OB, n =5 for WL). (g) TAZ, CLS, ALCAT1, and MLCLAT-1 mRNA levels in skeletal muscle (n =5 for OB, n =4 for WL). One-way ANOVA with multiple comparisons (c), two-way ANOVA with Sidak multiple comparisons (d, g) or unpaired t-test (f). All P-values except for those in panel c indicate statistical significance between OB and WL groups. P-values in panel c show comparisons between LN and OB and LN and WL. Data are represented as mean ± SEM.
