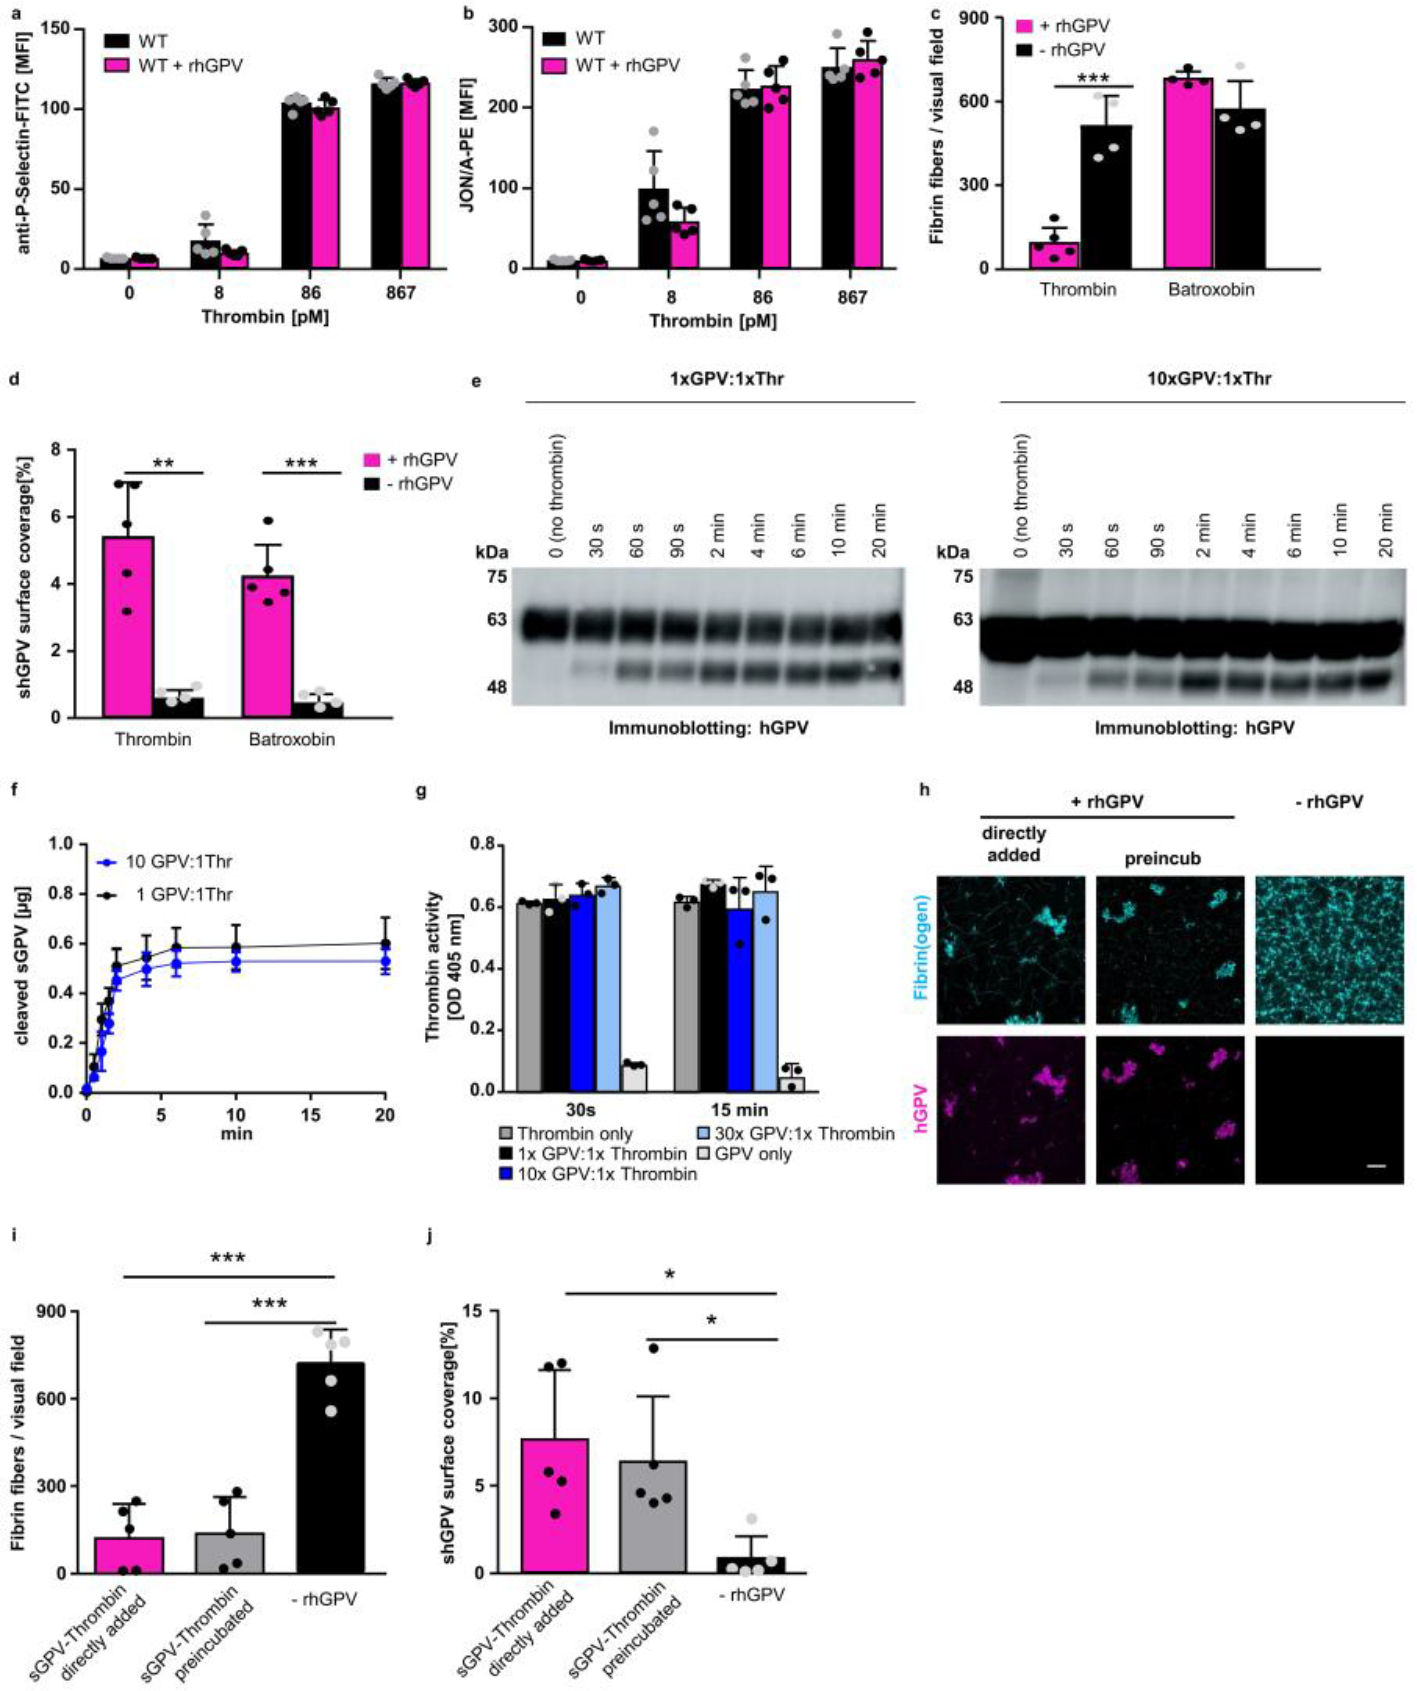
Extended Data Fig. 4. shGPV directly interacts with thrombin.

(a) P-selectin exposure at threshold thrombin concentrations in rhGPV-treated (20 μg/ml) and WT platelets. Mean ± SD of n=5 mice, 3 independent experiments. (b) Unaltered αIIbβ3 integrin activation (JON/A-PE binding) at threshold thrombin concentrations in the presence of rhGPV. Mean ± SD, n=5 mice, 3 independent experiments. Welch’s test. Fibrin fibres (c) and hGPV staining (d) were quantified upon static fibrin polymerization induced by thrombin or batroxobin in the absence or presence of rhGPV. Mean ± SD, (c) -rhGPV: n=4, rhGPV: n=5 (Thrombin), n=4 (Batroxobin), two-tailed unpaired t-test with Welch’s correction, p=0.0020, (d) -rhGPV: n=4, rhGPV: n=5 independent samples (mean of 2 ROI per sample), two-tailed unpaired t-test wit Welch’s correction, p=0.0029 (thrombin), p=0.0006 (batroxobin). (e-g) rhGPV and thrombin were incubated at equimolar ratio (1:1) or with an excess of rhGPV (10:1 ratio) and thrombin-mediated cleavage of rhGPV was assessed over time by immunoblotting. (f) Quantification of thrombin-cleaved sGPV over time. Mean ± SD, n=5 independent western blot experiments. (g) rhGPV and thrombin were incubated at equimolar ratio (1:1) or with an excess of rhGPV (10:1, 30:1 ratio) and the activity of thrombin was determined using a chromogenic thrombin substrate. Mean ± SD, n=3 independent samples, representative of 4 experiments. (h) Maximum projection of static fibrin polymerization induced by thrombin in the absence or presence of rhGPV (30:1 ratio). Thrombin and rhGPV were either directly added or preincubated for 10 min prior induction of polymerization. Fluorophore labelled fibrin(ogen): cyan, staining for hGPV: magenta. Scale bar: 20 μm. Quantification of fibrin fibres (i) and hGPV staining (j). Mean ± SD. n=5 biologic samples (mean of 2 ROI per sample), (i) one-way ANOVA followed by Tukey’s multiple comparison test, p>0.0001, (j) Kruskal-Wallis test followed by Dunn’s multiple comparisons test, p=0.0175 (directly vs. no rhGPV), p=0.0327 (preincubated vs. no rhGPV). *, p < 0.05; **p < 0.01; ***p < 0.001.
