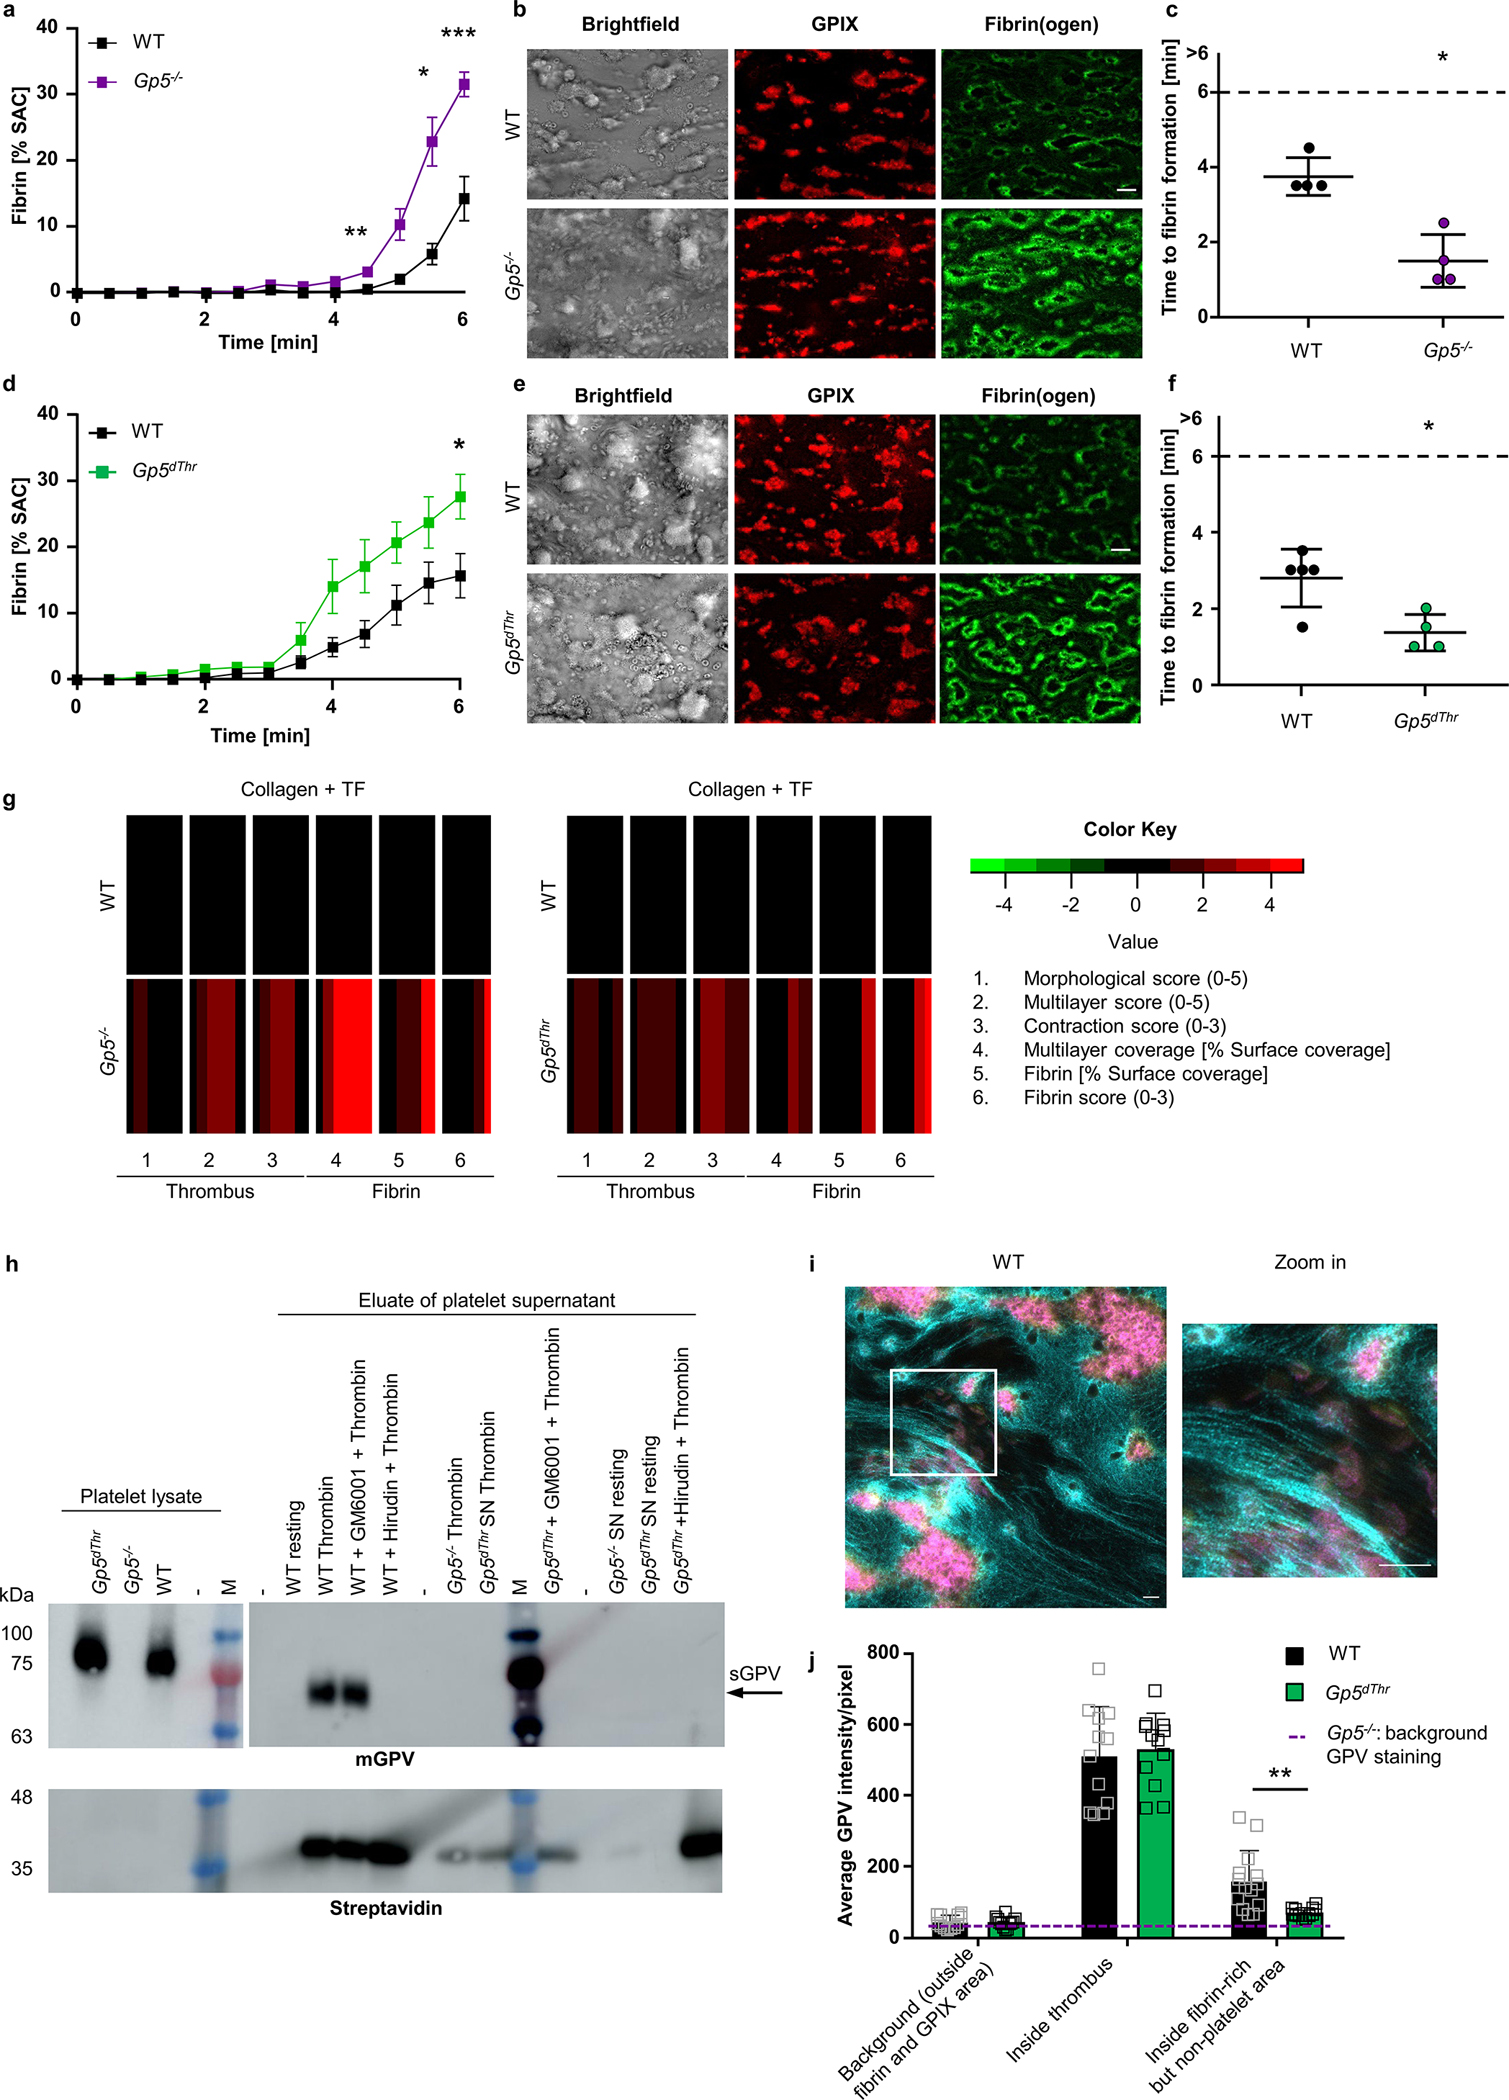
Fig. 2. GPV alters fibrin formation and localises to fibrin fibres outside the thrombus after thrombin cleavage.

(a) Time-dependent fibrin generation of Gp5−/− and WT mice was quantified. Mean ± SEM, WT: n=9, Gp5−/−: n= 8, 3 independent experiments. Two-tailed unpaired t-test with Welch’s correction. 4.5 min: p=0.0072, 5.5 min: p=0.0296, 6 min: p=0.0006. (b) Representative images of thrombus formation (anti-GPIX-AF647: red) and fibrin formation (fibrin(ogen)-AF488: green) on collagen/TF spots after 6 min. Scale bar: 20 μm. (c) Quantification of time to fibrin formation. One dot represents one animal. Mean ± SD, n=4, Two-tailed Mann-Whitney test. p=0.0286. (d-f) Fibrin formation on collagen/TF microspots of Gp5dThr and WT mice. Quantification of fibrin formation (d), time to fibrin formation (f) and representative images (e). Scale bar: 20 μm. Staining see (b). (d) mean ± SEM, WT: n=6, Gp5dThr: n=8, Two-tailed unpaired t-test with Welch’s correction. 6 min: p=0.0287. (f) Mean ± SD, WT: n=5, Gp5dThr: n=4, Two-tailed Mann-Whitney test. p=0.0317. SAC: surface area coverage. (g) Subtraction heatmap of parameters of thrombus (increased multilayer and contraction score) and fibrin formation in mutant mice compared to WT controls. Colours represent unchanged (black), decreased (green) or increased (red) parameters. (h) Pulldown of sGPV from WT platelets using streptavidin beads after stimulation with biotinylated thrombin in the presence/absence of GM6001 (matrix metalloproteinase inhibitor). No pulldown of sGPV from Gp5dThr platelets nor in the presence of hirudin, which prevents GPV cleavage by thrombin. Eluates were analysed by Western blotting using GPV-specific antibodies and streptavidin-HRP. Representative result of 5 independent experiments. M: marker, mGPV: murine GPV, arrow indicates pulldown of sGPV. (i, j) Recalcified blood was perfused over collagen/TF microspots. Samples were stained for platelets (anti-GPIX: yellow), fibrin(ogen) (cyan) and GPV (magenta), and analysed with a Zeiss Airyscan microscope. (i) Representative WT image and Zoom-in. Scale bar: 4 μm. (j) Quantification of GPV intensities inside fibrin-rich, but non-platelet area. Background GPV intensity in Gp5−/− images is displayed as dashed line. Two-way ANOVA followed by Tukey’s multiple comparisons test, n=14 (WT), n=12 (Gp5dThr), n=4 (Gp5−/−) ROI representing n=4 mice. Mean ± SD, p=0.0086. For detailed analysis see Supplementary Fig. 1. *p < 0.05; **p < 0.01; ***p < 0.001.
