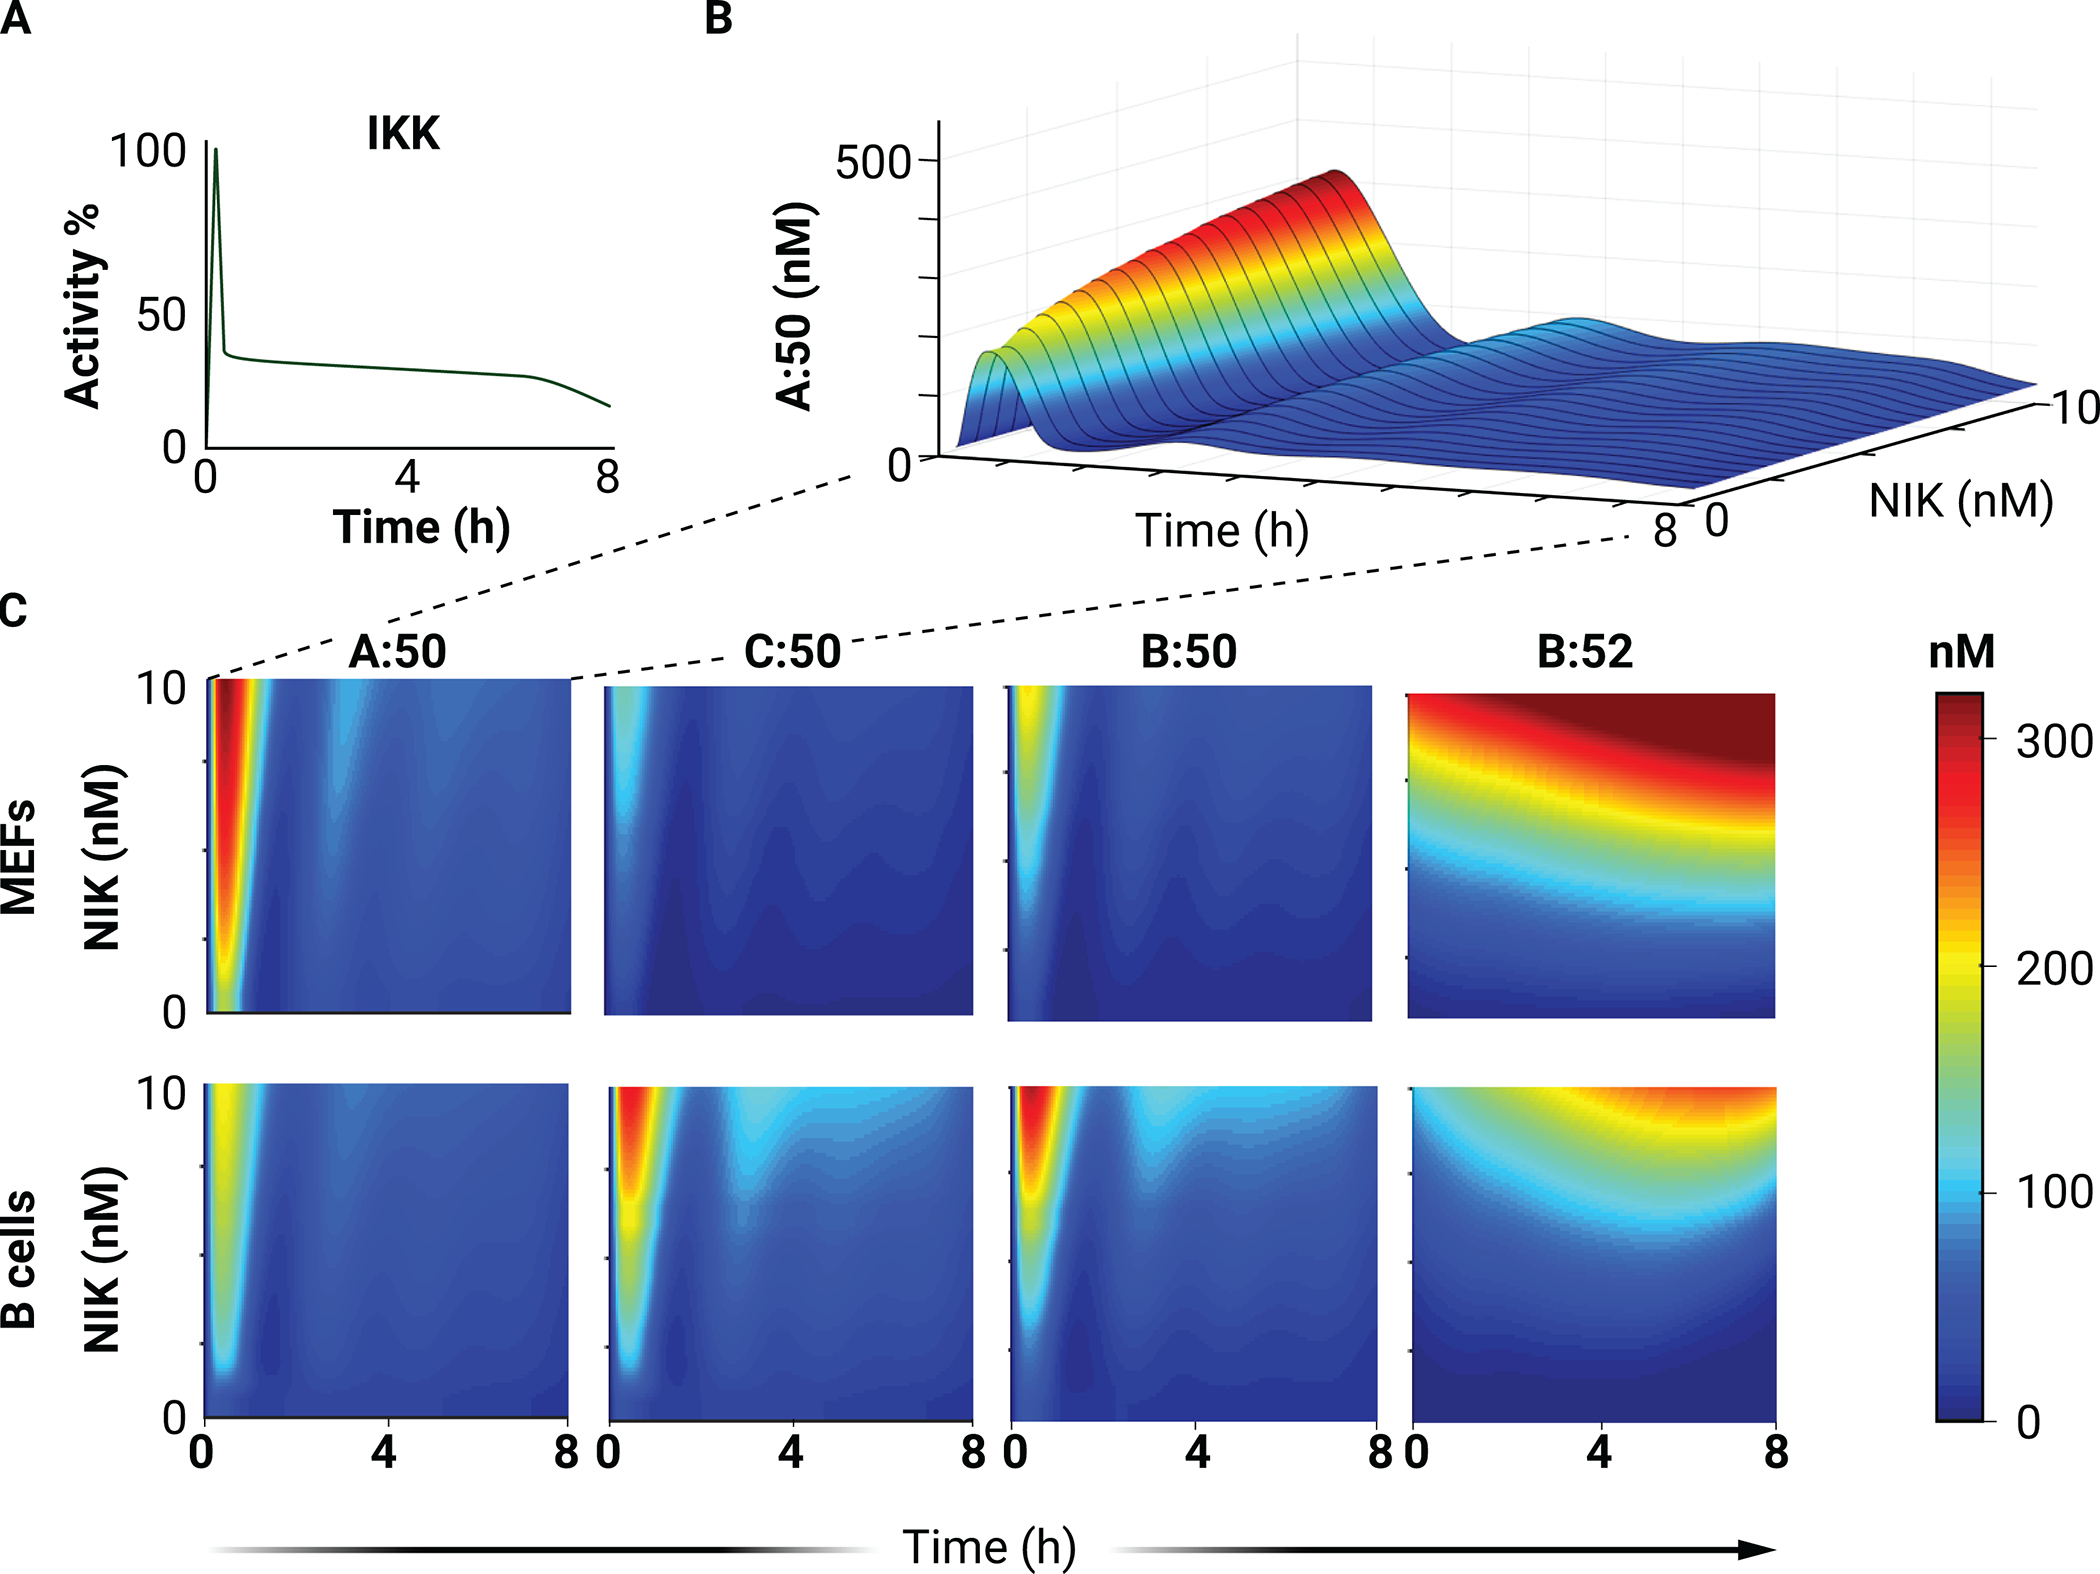
Fig. 4. Simulation of canonical (IKK-mediated) pathway activation at different basal levels of NIK activity.

(A) The physiological IKK activity curve used as input for all heatmaps. (B) Surface plot of RelA:p50 (A:50) abundance (A) in simulations with a physiological IKK activity curve and the indicated NIK abundances. (C) Heatmaps of the nuclear concentrations of the indicated NF-κB dimers in simulations with a physiological IKK activity curve and the indicated NIK abundances.
