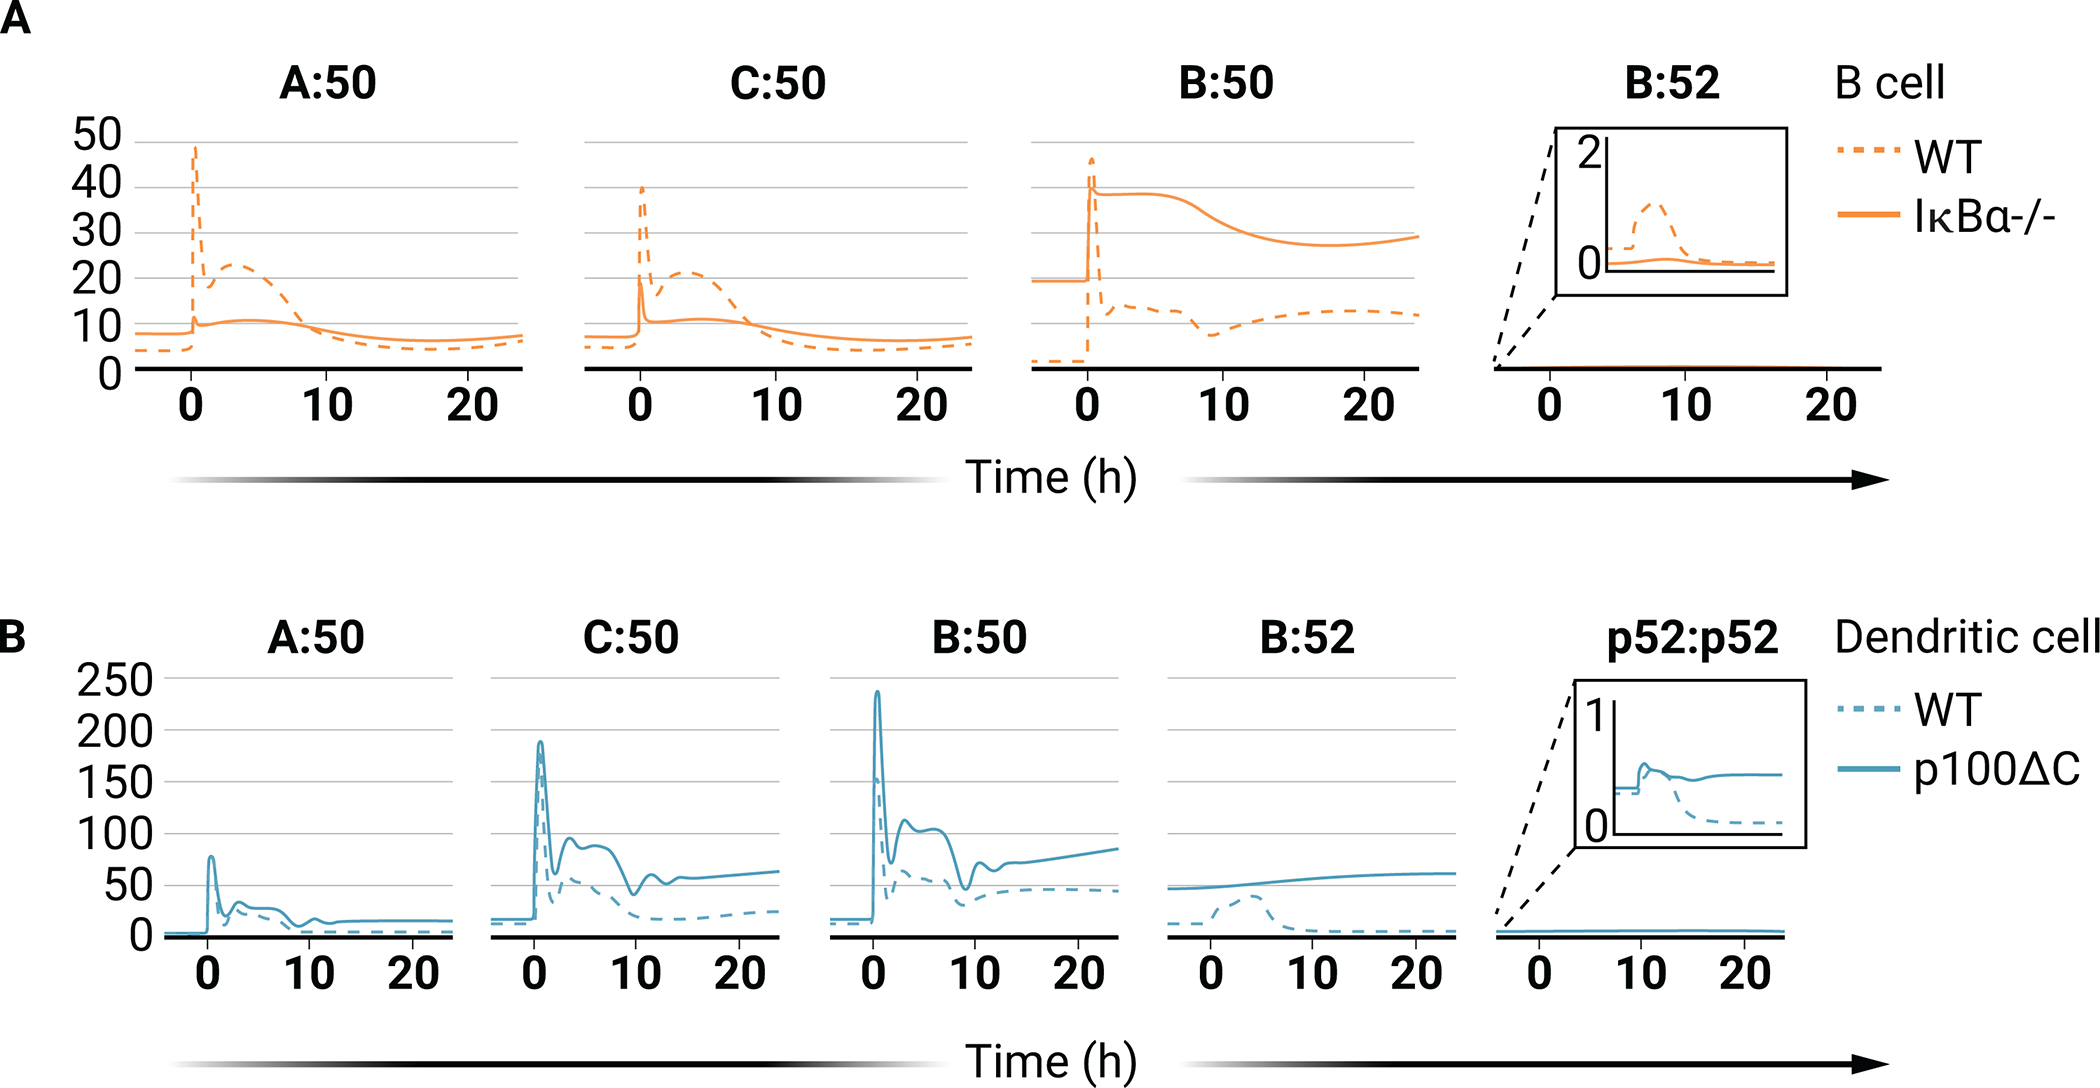
Fig. 6. NF-κB dimer repertoire in simulations of IκBα loss and nfkb2 truncation cancers.

(A) Line graphs of the abundances of the indicated NF-κB dimers in simulations of WT B cells (dashed lines) and IκBα-deficient B cells (solid lines). (B) Line graphs of the abundances of the indicated NF-κB dimers in simulations of WT DCs (dashed lines) and DCs expressing truncated nfkb2 (p100ΔC, solid lines). For (A) and (B), the IKK input curve used is from Fig. 4A and the abundance of NIK is kept constant.
