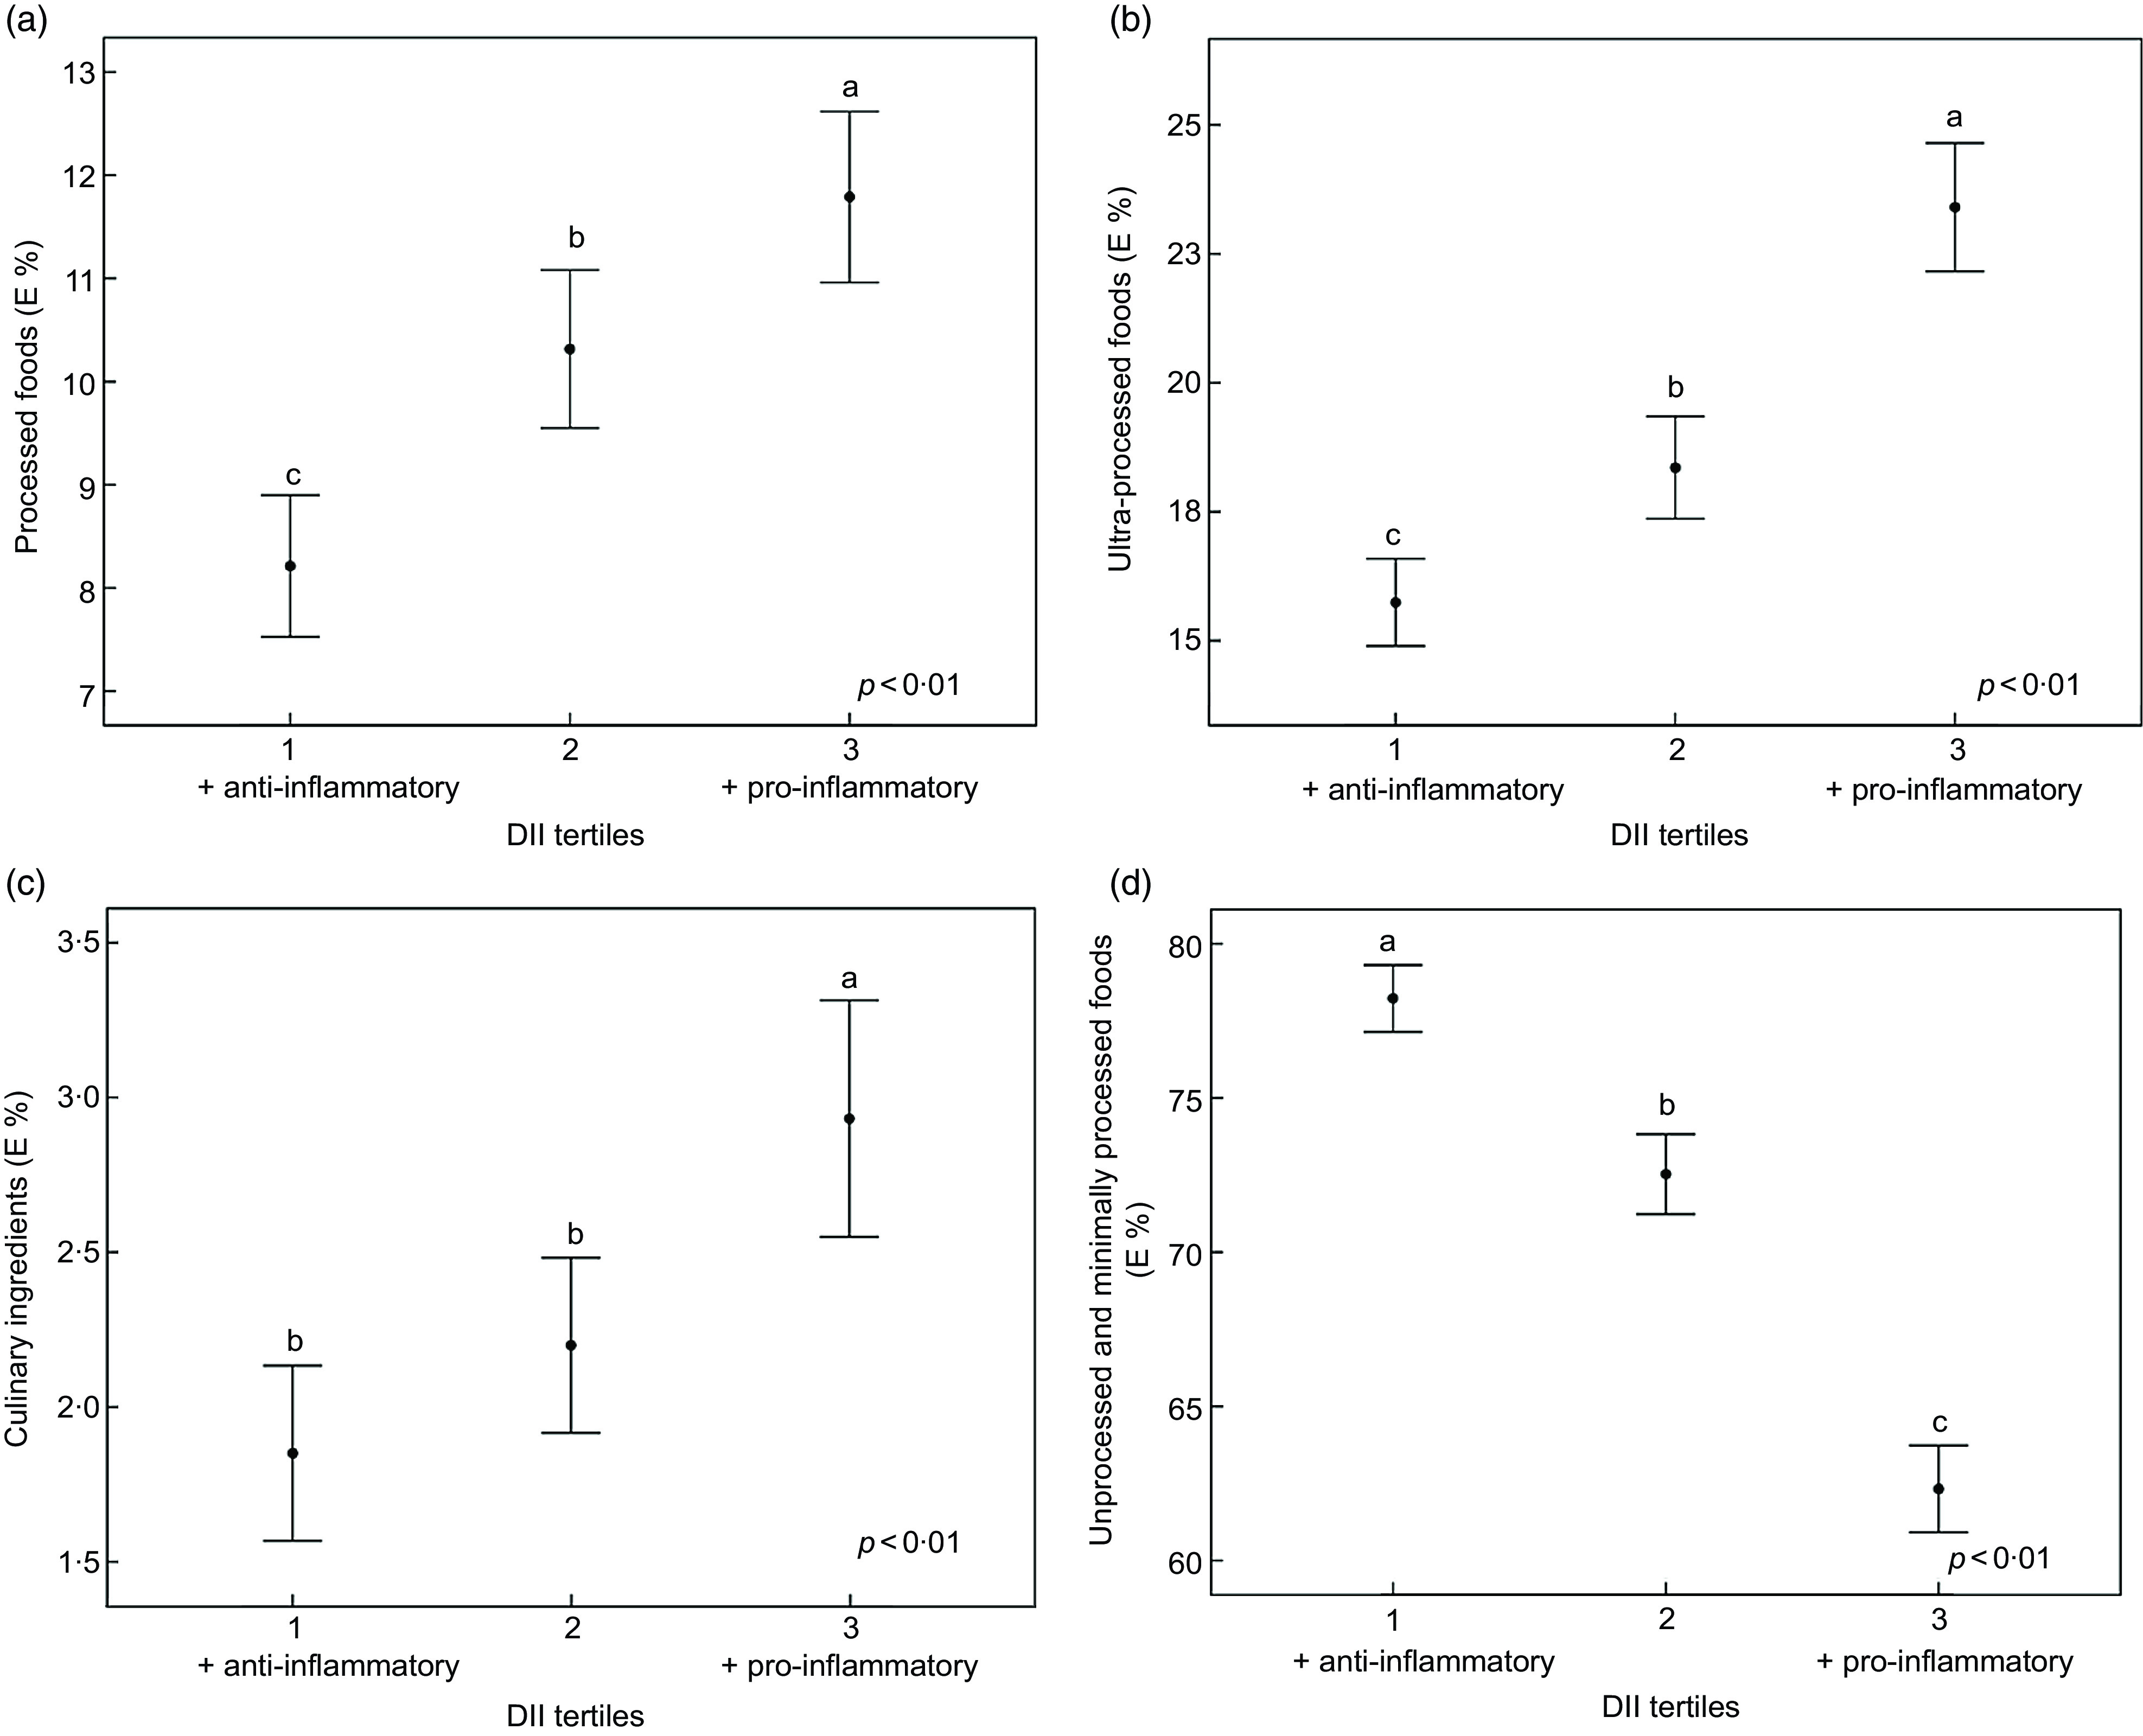
Fig. 2.

Association between DII and the E % of food consumption according to the NOVA classification (a, b, c and d). Data are mean and error bars are 95 % CI. DII, dietary inflammatory index; E, energy. Different letters show presence of difference and equal letters show the absence of differences according to Kruskal–Wallis test and Mann–Whitney U. P-values by multinomial logistic regression, adjusted for sex, age, diabetes, hypertension, dyslipidaemia and use of medicaments
