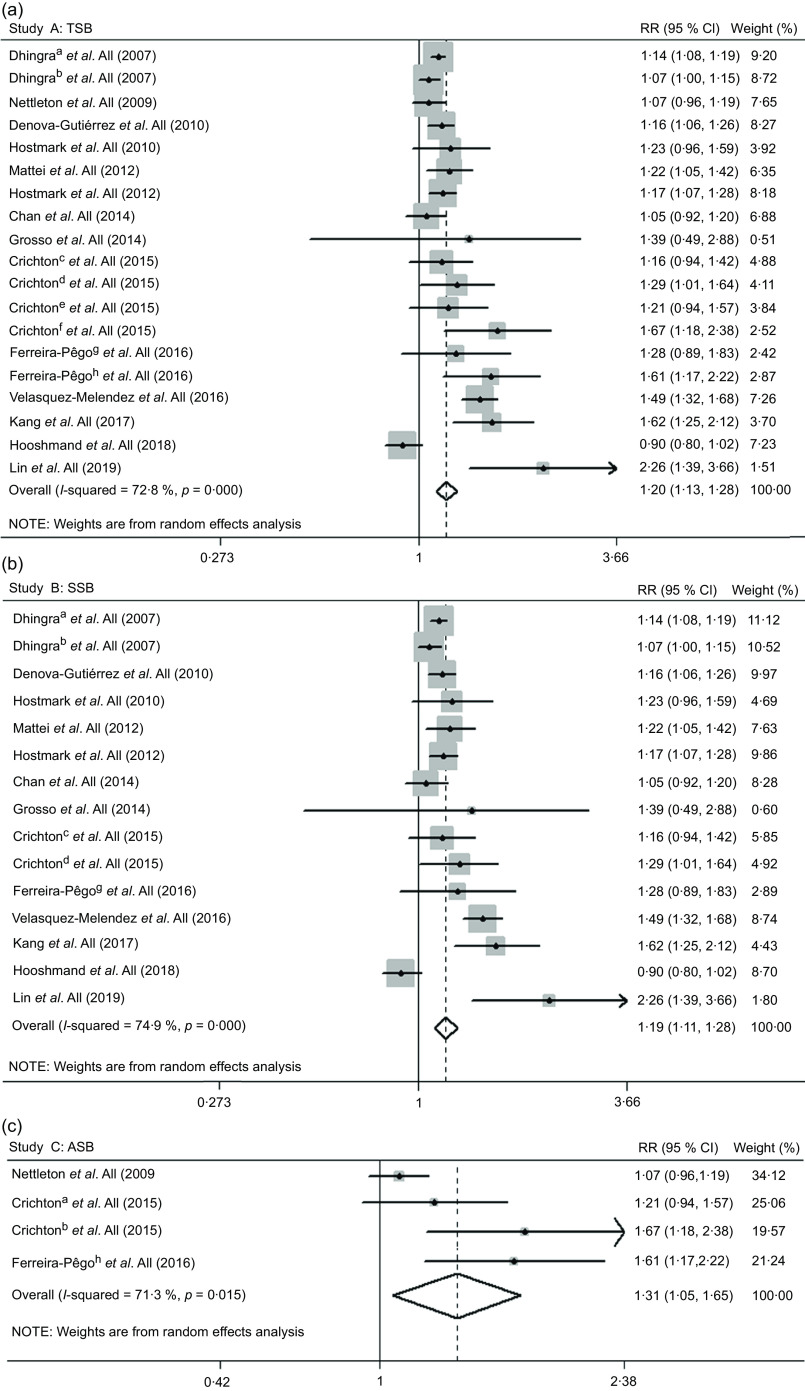
Fig. 3.
Forest plot of study-specific relative risk statistics for the risk of metabolic syndrome per 250 ml/d increase in total sweetened beverage (a), SSB (b) and ASB (c) consumption. a, cross-sectional study; b, longitudinal study; c, SSB in the Maine-Syracuse Longitudinal Study; d, ASB in the Maine-Syracuse Longitudinal Study; e, SSB in the Observation of Cardiovascular Risk Factors in Luxembourg Study; f, ASB in the Observation of Cardiovascular Risk Factors in Luxembourg Study; g, SSB; h, ASB. ASB, artificially sweetened beverages; RR, relative risk; SSB, sugar-sweetened beverages; TSB, total sweetened beverages

