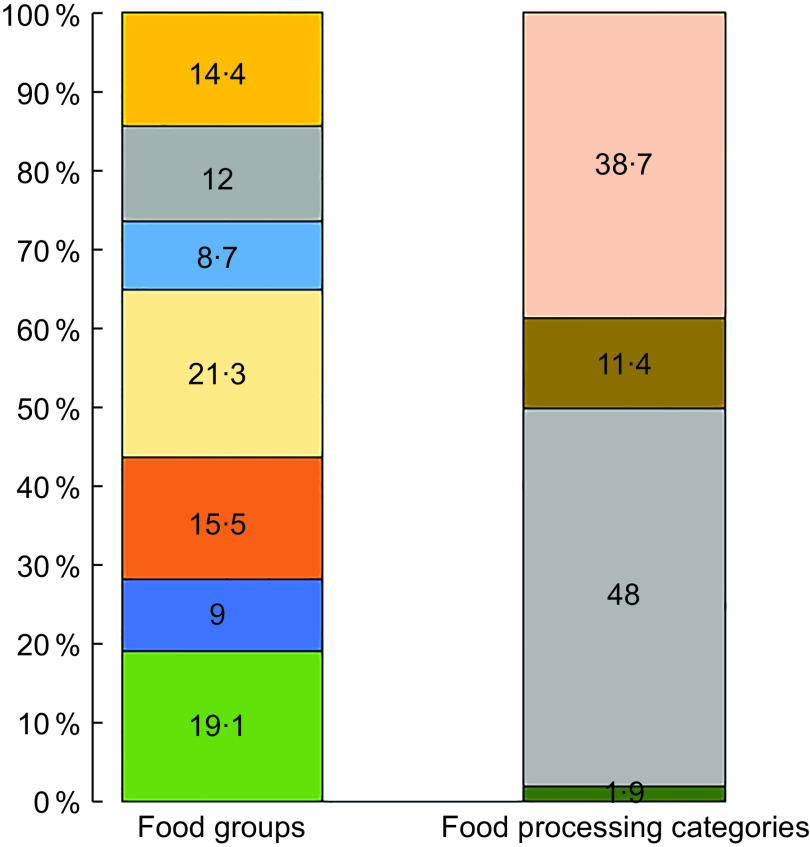
Fig. 1.
Percentage distribution of the Brazil foods by MyPlate food group and by NOVA food processing categories. , Dairy;
  , meat, poultry and fish;
  , beans, nuts and seeds;
  , grains;
  , vegetables;
  , fruit and fruit juices;
  , fats and sweets;
  , unprocessed;
  , processed;
  , ultra-processed;
  , culinary ingredients

