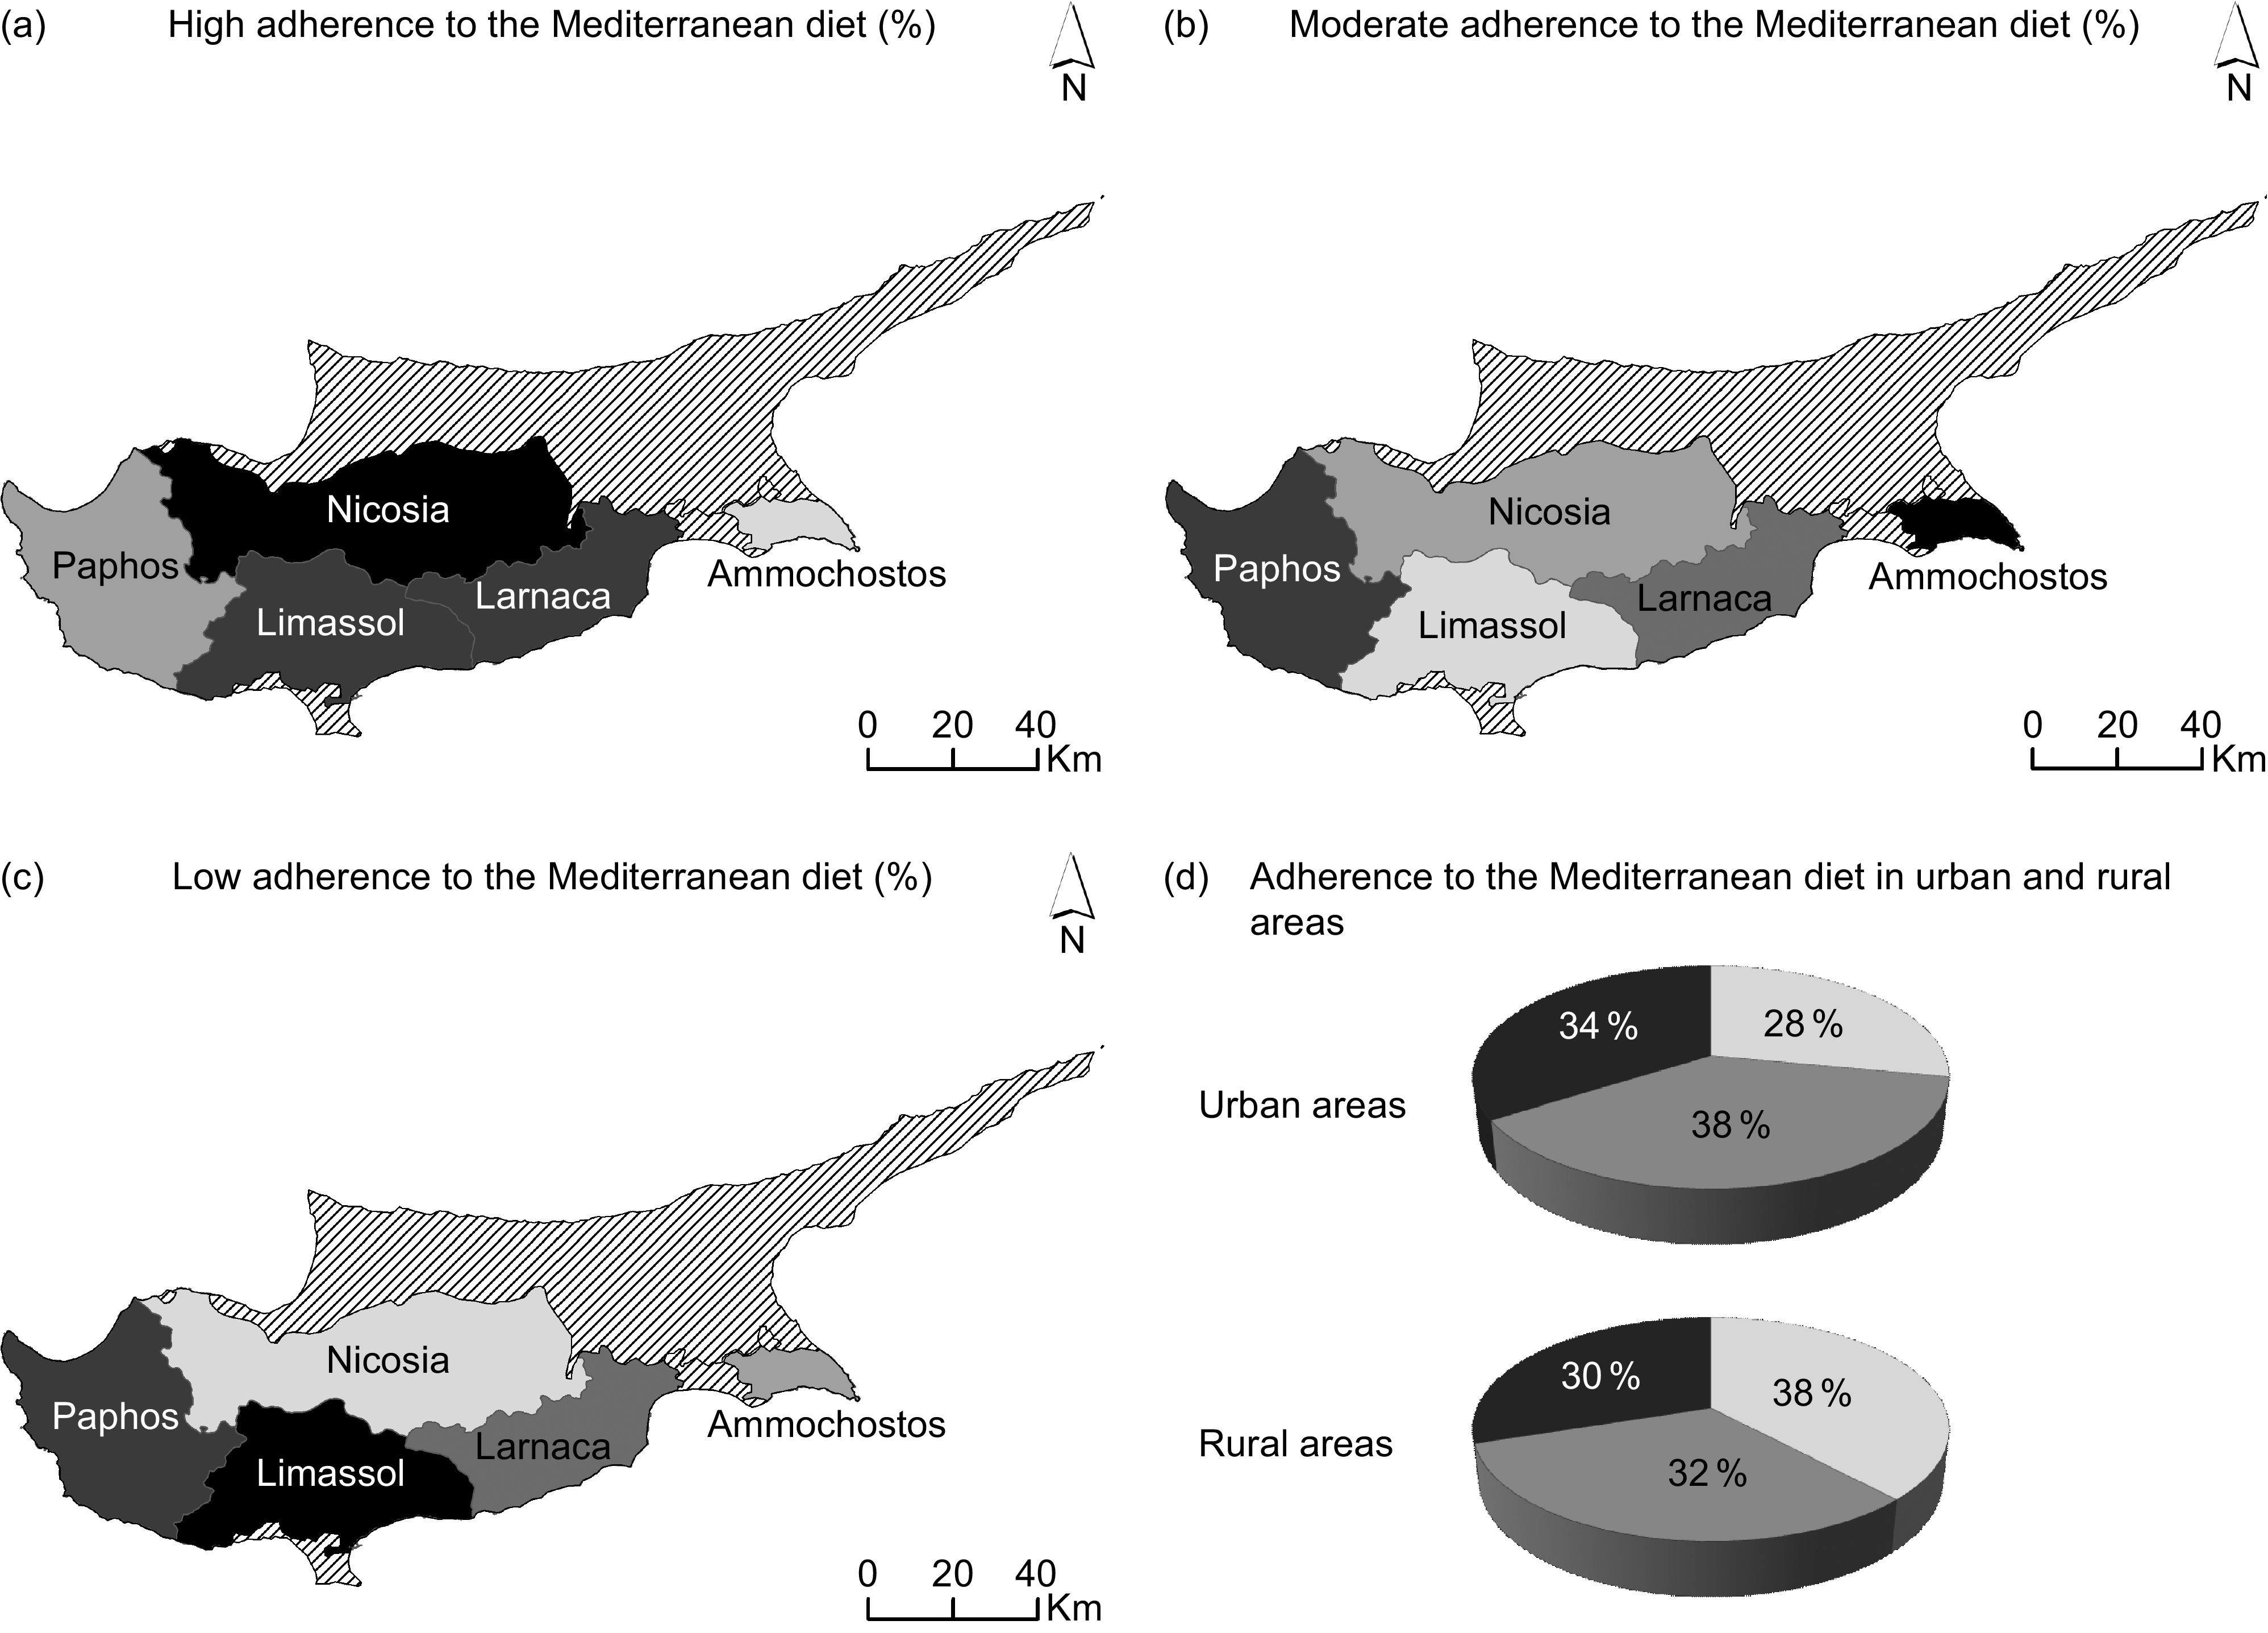
Fig. 1.

Spatial analysis of Mediterranean diet adherence by region of residence and level of urbanicity. (a) High adherence to the Mediterranean diet (%).  , 39;
, 39;  , 37;
, 37;  , 33;
, 33;  , 26;
, 26;  , Non-government controlled areas. (b) Moderate adherence to the Mediterranean diet (%).
  , 39;
, 39;  , 38;
, 38;  , 35;
, 35;  , 34;
, 34;  , 27;
, 27;  , Non-government controlled areas. (c) Low adherence to the Mediterranean diet (%).
  , 36;
, 36;  , 34;
, 34;  , 32;
, 32;  , 29;
, 29;  , 28;
, 28;  , Non-government controlled areas. (d) Adherence to the Mediterranean diet in urban and rural areas (%).
  , High;
  , moderate;
  , low
, low
