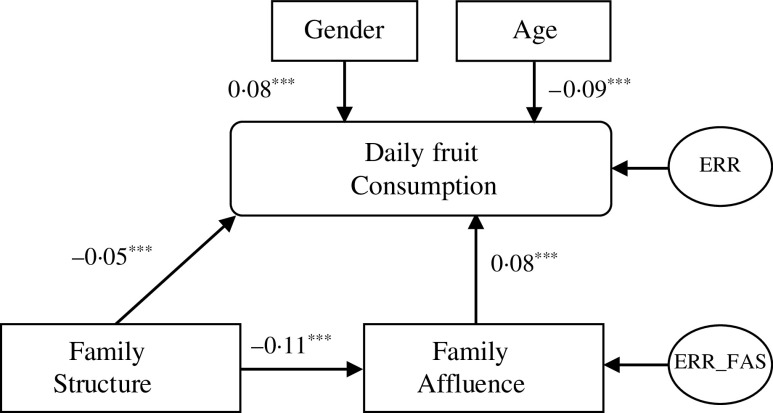
Fig. 1.
Path model of daily fruit consumption. Arrows indicate a direction of the association; the numbers are standardised regression weights (β). Estimations were done from the total sample of forty-one countries. ERR and ERR_FAS are other determinants that affect corresponding variables. *** P < 0·001

